


#73 Blackrock
Global leader in Asset Management

Dear Readers,
Thank you for being here and showing interest in my work! Your support means the world to me. If you enjoyed this article and would like to see more, please consider subscribing and giving it a like—it really helps grow our community of investors. Thank you for your continued support!
Please read the disclaimer at the end of this article. This is not an investment advice!
About Blackrock
BlackRock, Inc. is a global investment management corporation headquartered in New York, managing $11.6 trillion in assets under management (AUM) as of December 31, 2024. This milestone was achieved following a record $641 billion in full-year net inflows, including $281 billion in the fourth quarter alone. In 2024, BlackRock demonstrated strong financial performance with a 14% increase in full-year revenue, driven by positive market impacts, organic base fee growth, and contributions from strategic acquisitions. Operating income grew by 21% (23% on an adjusted basis), while diluted earnings per share (EPS) rose 15% to $42.01 ($43.61 adjusted). Additionally, the company returned $4.7 billion to shareholders through dividends and $1.6 billion in share repurchases.

BlackRock’s business is highly diversified, spanning a wide range of asset classes, including equity (55% of AUM), fixed income (25%), multi-asset (8%), and alternatives (4%). It serves both retail and institutional clients globally, with significant business operations in the Americas, EMEA, and Asia-Pacific regions. A key growth driver in 2024 was the completion of major strategic acquisitions, including the closing of the Global Infrastructure Partners (GIP) deal and agreements to acquire HPS Investment Partners and Preqin. These acquisitions are expected to significantly enhance BlackRock’s private markets and data capabilities.
With clients in over 100 countries, BlackRock is a leader in exchange-traded funds (ETFs), accounting for 37% of its AUM, as well as in index investing and financial technology services, particularly through its proprietary platform, Aladdin®. Under the leadership of Chairman and CEO Laurence D. Fink, BlackRock continues to focus on long-term growth, client service excellence, and technological innovation to solidify its position as a global financial powerhouse.
The History of BlackRock
BlackRock was founded in 1988 by Laurence D. Fink and seven partners as part of Blackstone Group, with a focus on risk management and fixed income investments. In 1994, BlackRock became an independent company, separating from Blackstone, and rapidly expanded its product offerings to include equities and alternatives.
The company went public in 1999, raising capital to fuel growth and global expansion. A key milestone came in 2006 with the acquisition of Merrill Lynch Investment Managers (MLIM), doubling its assets under management (AUM) and establishing BlackRock as a global leader.
During the 2008 Global Financial Crisis, BlackRock’s expertise in risk management made it a key advisor to governments, managing distressed assets for the U.S. government. In 2009, BlackRock acquired Barclays Global Investors (BGI), including the iShares ETF business, catapulting it to the position of the world’s largest asset manager.
Throughout the 2010s, BlackRock expanded globally, diversified into private markets, and launched its Aladdin® technology platform, becoming a leader in investment technology. It also embraced sustainable investing, integrating ESG (Environmental, Social, and Governance) principles into its strategies.
In the 2020s, BlackRock continued its growth with strategic acquisitions, including Global Infrastructure Partners (GIP) and deals with HPS Investment Partners and Preqin, strengthening its presence in private markets and data analytics. By 2024, BlackRock managed over $11.6 trillion in AUM, solidifying its role as a dominant force in global finance.
Blackrocks Business Model
BlackRock’s business model is centered around providing investment management, risk management, and advisory services to a diverse client base that includes institutions, governments, and individual investors globally. The company operates as a fee-based business, primarily generating revenue from management and advisory fees linked to assets under management (AUM). BlackRock’s diversified business model spans multiple asset classes, investment strategies, and technology solutions, which helps mitigate risks associated with market fluctuations and ensures consistent revenue streams.
Key Segments of BlackRock’s Business Model
Investment Management Services
This is BlackRock’s core business, managing over $11.6 trillion in AUM as of December 31, 2024.
The firm offers a broad range of products across asset classes, including equities, fixed income, multi-asset strategies, alternatives, and cash management.
Breakdown by Product Type:
Equity (55% of AUM): Includes active equity funds, index funds, and ETFs, such as the iShares product line. BlackRock earns management fees based on a percentage of the assets, with equity products typically generating higher fees compared to fixed income.
Fixed Income (25% of AUM): Includes government bonds, corporate debt, high-yield bonds, and emerging market debt. Fixed income products are particularly popular with institutional investors and play a key role in diversifying portfolios.
Multi-Asset (8% of AUM): Combines different asset classes to create diversified investment solutions. This segment is often tailored for retirement funds and institutional clients seeking balanced strategies.
Alternatives (4% of AUM): Includes private equity, hedge funds, real estate, infrastructure, and private credit. Alternatives generate higher fees due to their complexity and potential for higher returns.
iShares (Exchange-Traded Funds - ETFs)
BlackRock is the global leader in ETFs through its iShares brand, which accounts for approximately 37% of the company’s AUM.
ETFs provide cost-effective, transparent, and flexible investment solutions, attracting both retail and institutional investors.
Revenue from iShares comes primarily from management fees, though these are generally lower than actively managed funds due to the passive nature of many ETFs. However, the massive scale of iShares compensates for the lower fee rates.
Technology Services (Aladdin® Platform)
BlackRock’s Aladdin® platform is a leading investment and risk management technology used by asset managers, insurance companies, banks, and other financial institutions globally.
Aladdin generates revenue through technology services fees and subscriptions, providing recurring, high-margin income. This segment differentiates BlackRock from traditional asset managers by offering a scalable technology solution that integrates data analytics, portfolio management, and risk assessment tools.
Advisory and Other Services
BlackRock offers advisory services to sovereign wealth funds, pension funds, governments, and financial institutions. This includes strategic consulting on asset allocation, risk management, and investment strategy.
The company also earns performance fees based on the outperformance of certain actively managed strategies, particularly in alternative investments and private markets. Performance fees are variable and depend on market conditions and fund performance.
Private Markets and Alternatives
With acquisitions like Global Infrastructure Partners (GIP) and investments in private credit and real estate, BlackRock has been expanding its presence in private markets.
Revenue from this segment comes from management fees, performance-based fees, and carried interest, which is a share of the profits generated by private equity and infrastructure investments.
Revenue Streams
BlackRock’s revenue can be categorized into several key streams:
Base Management Fees (74% of Total Revenue)
Charged as a percentage of AUM and vary based on the type of product (higher for alternatives, lower for ETFs).
These fees are relatively stable and recurring, providing a predictable income stream.
Performance Fees (Approximately 6-8%)
Earned when actively managed funds or alternative investments outperform their benchmarks.
Performance fees are common in hedge funds, private equity, and infrastructure investments.
Technology Services Revenue (Around 8%)
Generated from licensing the Aladdin® platform and related technology solutions to institutional clients.
This revenue is recurring, subscription-based, and has high margins due to the scalability of the platform.
Advisory and Other Revenue (3-4%)
Includes fees from advisory mandates, consulting services, and fiduciary duties for large institutional clients and governments.
BlackRock has been involved in advising central banks and sovereign wealth funds, especially during times of financial crises.
Distribution Fees
Earned from distributing investment products through third-party intermediaries like banks, brokers, and financial advisors.
These fees help expand BlackRock’s reach to retail investors.
Securities Lending Revenue
Generated when BlackRock lends securities held in its funds to other financial institutions in exchange for a fee.
This practice helps enhance returns for clients, particularly in index and ETF products.
Why BlackRock’s Business Model Is Effective
Diversification: BlackRock’s business is diversified across asset classes, client segments, and geographies, reducing reliance on any single revenue source.
Scale and Efficiency: With trillions in AUM, BlackRock benefits from economies of scale, allowing it to operate efficiently while offering competitive fees.
Technology Leadership: Aladdin provides a unique competitive advantage, offering both internal risk management tools and an external revenue stream from technology clients.
Resilience: The firm generates revenue in both bullish and bearish markets through its diversified product offerings and counter-cyclical demand for certain products like fixed income and risk management solutions.
Global Reach: Operating in over 100 countries, BlackRock serves a wide range of institutional and retail clients, reducing dependency on any single market.
In summary, BlackRock’s business model is built on the pillars of scale, diversification, innovation, and strong client relationships. Its ability to generate revenue from asset management, technology, advisory services, and performance fees ensures consistent growth and resilience across market cycles.
Assets under managements as the key component
Assets Under Management (AUM) refers to the total market value of the financial assets that an investment firm like BlackRock manages on behalf of its clients. This includes a diverse range of asset classes such as equities, fixed income, alternatives, multi-asset strategies, and cash. AUM serves as a key indicator of the firm’s business scale, reflecting how much client money is entrusted to BlackRock for investment and management purposes. It is measured by summing up the current market value of all the investments managed by the firm, which encompasses client assets in mutual funds, exchange-traded funds (ETFs), separate accounts, discretionary assets—where BlackRock has full control over investment decisions—and non-discretionary assets, where BlackRock provides advice but the client retains final control over investment choices. AUM fluctuates daily due to changes in market performance, as the value of underlying assets rises or falls, and due to net flows, which represent the difference between new money coming into the firm (inflows) and money being withdrawn (outflows).
Inflows refer to new capital that clients invest into BlackRock’s products, including contributions to mutual funds, ETF subscriptions, new institutional mandates, and deposits into managed accounts. Conversely, outflows represent withdrawals or redemptions by clients, whether due to personal liquidity needs or decisions to move funds to another manager. Net flows are calculated by subtracting outflows from inflows, with positive net flows indicating growth in AUM from new client money, while negative net flows suggest that more money is being withdrawn than invested.
AUM is critically important to BlackRock because it directly drives the company’s revenue, as management fees are typically charged as a percentage of AUM. This means that higher AUM translates into higher fee income. Additionally, AUM serves as a key indicator of business growth, reflecting the firm’s success in attracting new clients and retaining existing ones, as well as demonstrating market confidence in its investment capabilities. The scale provided by large AUM also enables BlackRock to achieve operational efficiencies, reducing costs per unit of AUM and allowing the firm to offer competitive pricing, particularly in cost-sensitive products like ETFs and index funds. Furthermore, with over $11 trillion in AUM, BlackRock holds significant influence in global financial markets, impacting corporate governance through proxy voting and active engagement with companies. For investors and analysts, AUM growth is a vital performance metric, signaling the firm’s ability to generate consistent revenue, expand its client base, and maintain a strong competitive position in the asset management industry.
Major risks for Blackrock
BlackRock faces several key risks that could impact its financial performance, operations, and long-term growth. One of the most significant risks is market risk, as the company’s revenue is closely tied to the performance of global financial markets. A substantial market downturn can lead to declines in asset values, which directly reduces BlackRock’s assets under management (AUM) and, consequently, its management fees. Additionally, interest rate fluctuations pose risks, particularly for fixed income portfolios, as changes in interest rates can affect both investment performance and client demand for certain products.
Another major challenge is fee pressure and competitive risk. The asset management industry is highly competitive, with intense rivalry from both traditional firms and low-cost providers, especially in the rapidly growing ETF and index fund markets. This has resulted in a trend of fee compression, as clients increasingly demand low-cost investment solutions. The pressure to lower fees can squeeze profit margins, particularly as competitors continue to aggressively reduce costs to attract investors.
Regulatory and legal risks also play a critical role in BlackRock’s risk landscape. Operating in multiple jurisdictions worldwide, the firm is subject to a wide range of complex and evolving regulations. Changes in financial regulations can lead to increased compliance costs, restrictions on product offerings, or more stringent reporting requirements. Furthermore, as one of the largest asset managers globally, BlackRock faces heightened scrutiny from regulators concerned about its potential role in systemic financial risk, which could result in stricter oversight.
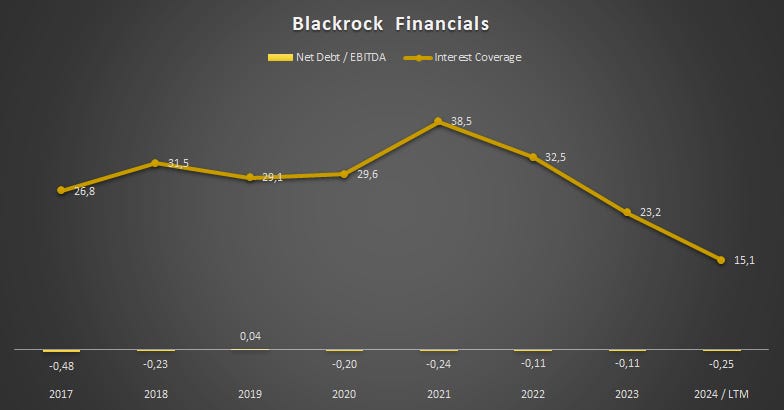
Key financials
BlackRock stands out with exceptionally strong financials. Although revenue growth slowed slightly after 2021 due to market fluctuations during the COVID-19 period, the company has since reached a record high. Additionally, its free cash flow generation remains robust, contributing to impressive margins and outstanding returns. Since visuals often speak louder than words, I’ll keep it brief here and highlight the key figures in the following graphs.


Stock valuation
Base Case Assumptions
BlackRock is poised to remain the global leader in asset management in the years ahead, with continued growth in its assets under management (AUM). Despite ongoing competitive pressure and fee compression, BlackRock is well-positioned to increase its revenues while maintaining its impressive margins. This outlook is based on the assumption that geopolitical conditions remain relatively stable. Naturally, market fluctuations and other external risks could have a significant impact on performance, but BlackRock’s diversified business model and strong risk management framework provide resilience in navigating such challenges.
Revenue Growth
In the DCF Model, a five-year detailed planning period is used, projecting a 8.7% Compound Annual Growth Rate (CAGR). This trajectory anticipates Blackrocks‘s revenue to reach about $30 billion in FY 2029.
Normalized Net Income Margin
I estimate a normalized net income margin of approximately 29.4% over the forecasting period. While this is notably lower than the 31.2% margin achieved over the past 12 months, this projection adopts a more conservative stance, reflecting uncertainty about the sustainability of such elevated margin levels in the long term.
Free Cash Flow
My Free Cash Flow assumptions are based on a Net Capex ratio (Net Capex = Capex - Depreciation) of 0.3% of sales, consistent with the average of recent years and reflective of Blackrocks's asset-light model. Working Capital, expressed as a percentage of sales, is derived from the historical average, calculated at 2% of net sales. The Free Cash Flow estimate does not account for adjustments related to stock-based compensation. These assumptions result in a normalized Free Cash Flow margin of approximately 29%.
WACC
The Weighted Average Cost of Capital (WACC) is set at 7.5%.
Results
Based on these assumptions, Blackrocks’s equity value is estimated at $138 billion. Dividing this by the current number of shares, we derive a fair value per share of $864 BLK 0.00%↑ . In comparison to its latest stock price of $992 the stock appears overvalued.
Adjusting the WACC to 8.0% would lower the fair value per share to $950, while a decrease in WACC to 7.0% would increase it to $792 per share.
Scenarios
In the two tables below, I present my estimated fair values for the stock under three key scenarios: baseline, bear case, and bull case, providing a range for comparison. These estimates are derived from my Discounted Cash Flow (DCF) valuation, reflecting varying assumptions about growth rates, margins, and other key factors.
The baseline scenario corresponds to the 50% column, representing the most likely outcome. The 90% confidence interval represents the bull case, while the 10% confidence interval reflects the bear case, with intermediate scenarios filling the remaining columns. This framework offers a comprehensive view of potential outcomes based on different assumptions.
The second table presents the margin of safety, calculated as the ratio of the estimated fair value to the current share price. To make this more visually intuitive:
Margins of safety above 125% are highlighted in green, indicating that the stock meets my personal margin of safety threshold.
Margins between 100% and 125% are marked yellow, suggesting a moderate level of safety.
Margins below 100% indicate potential overvaluation and are marked red.
This approach provides a clear and systematic way to evaluate the stock's fair value and its attractiveness based on risk-adjusted scenarios.

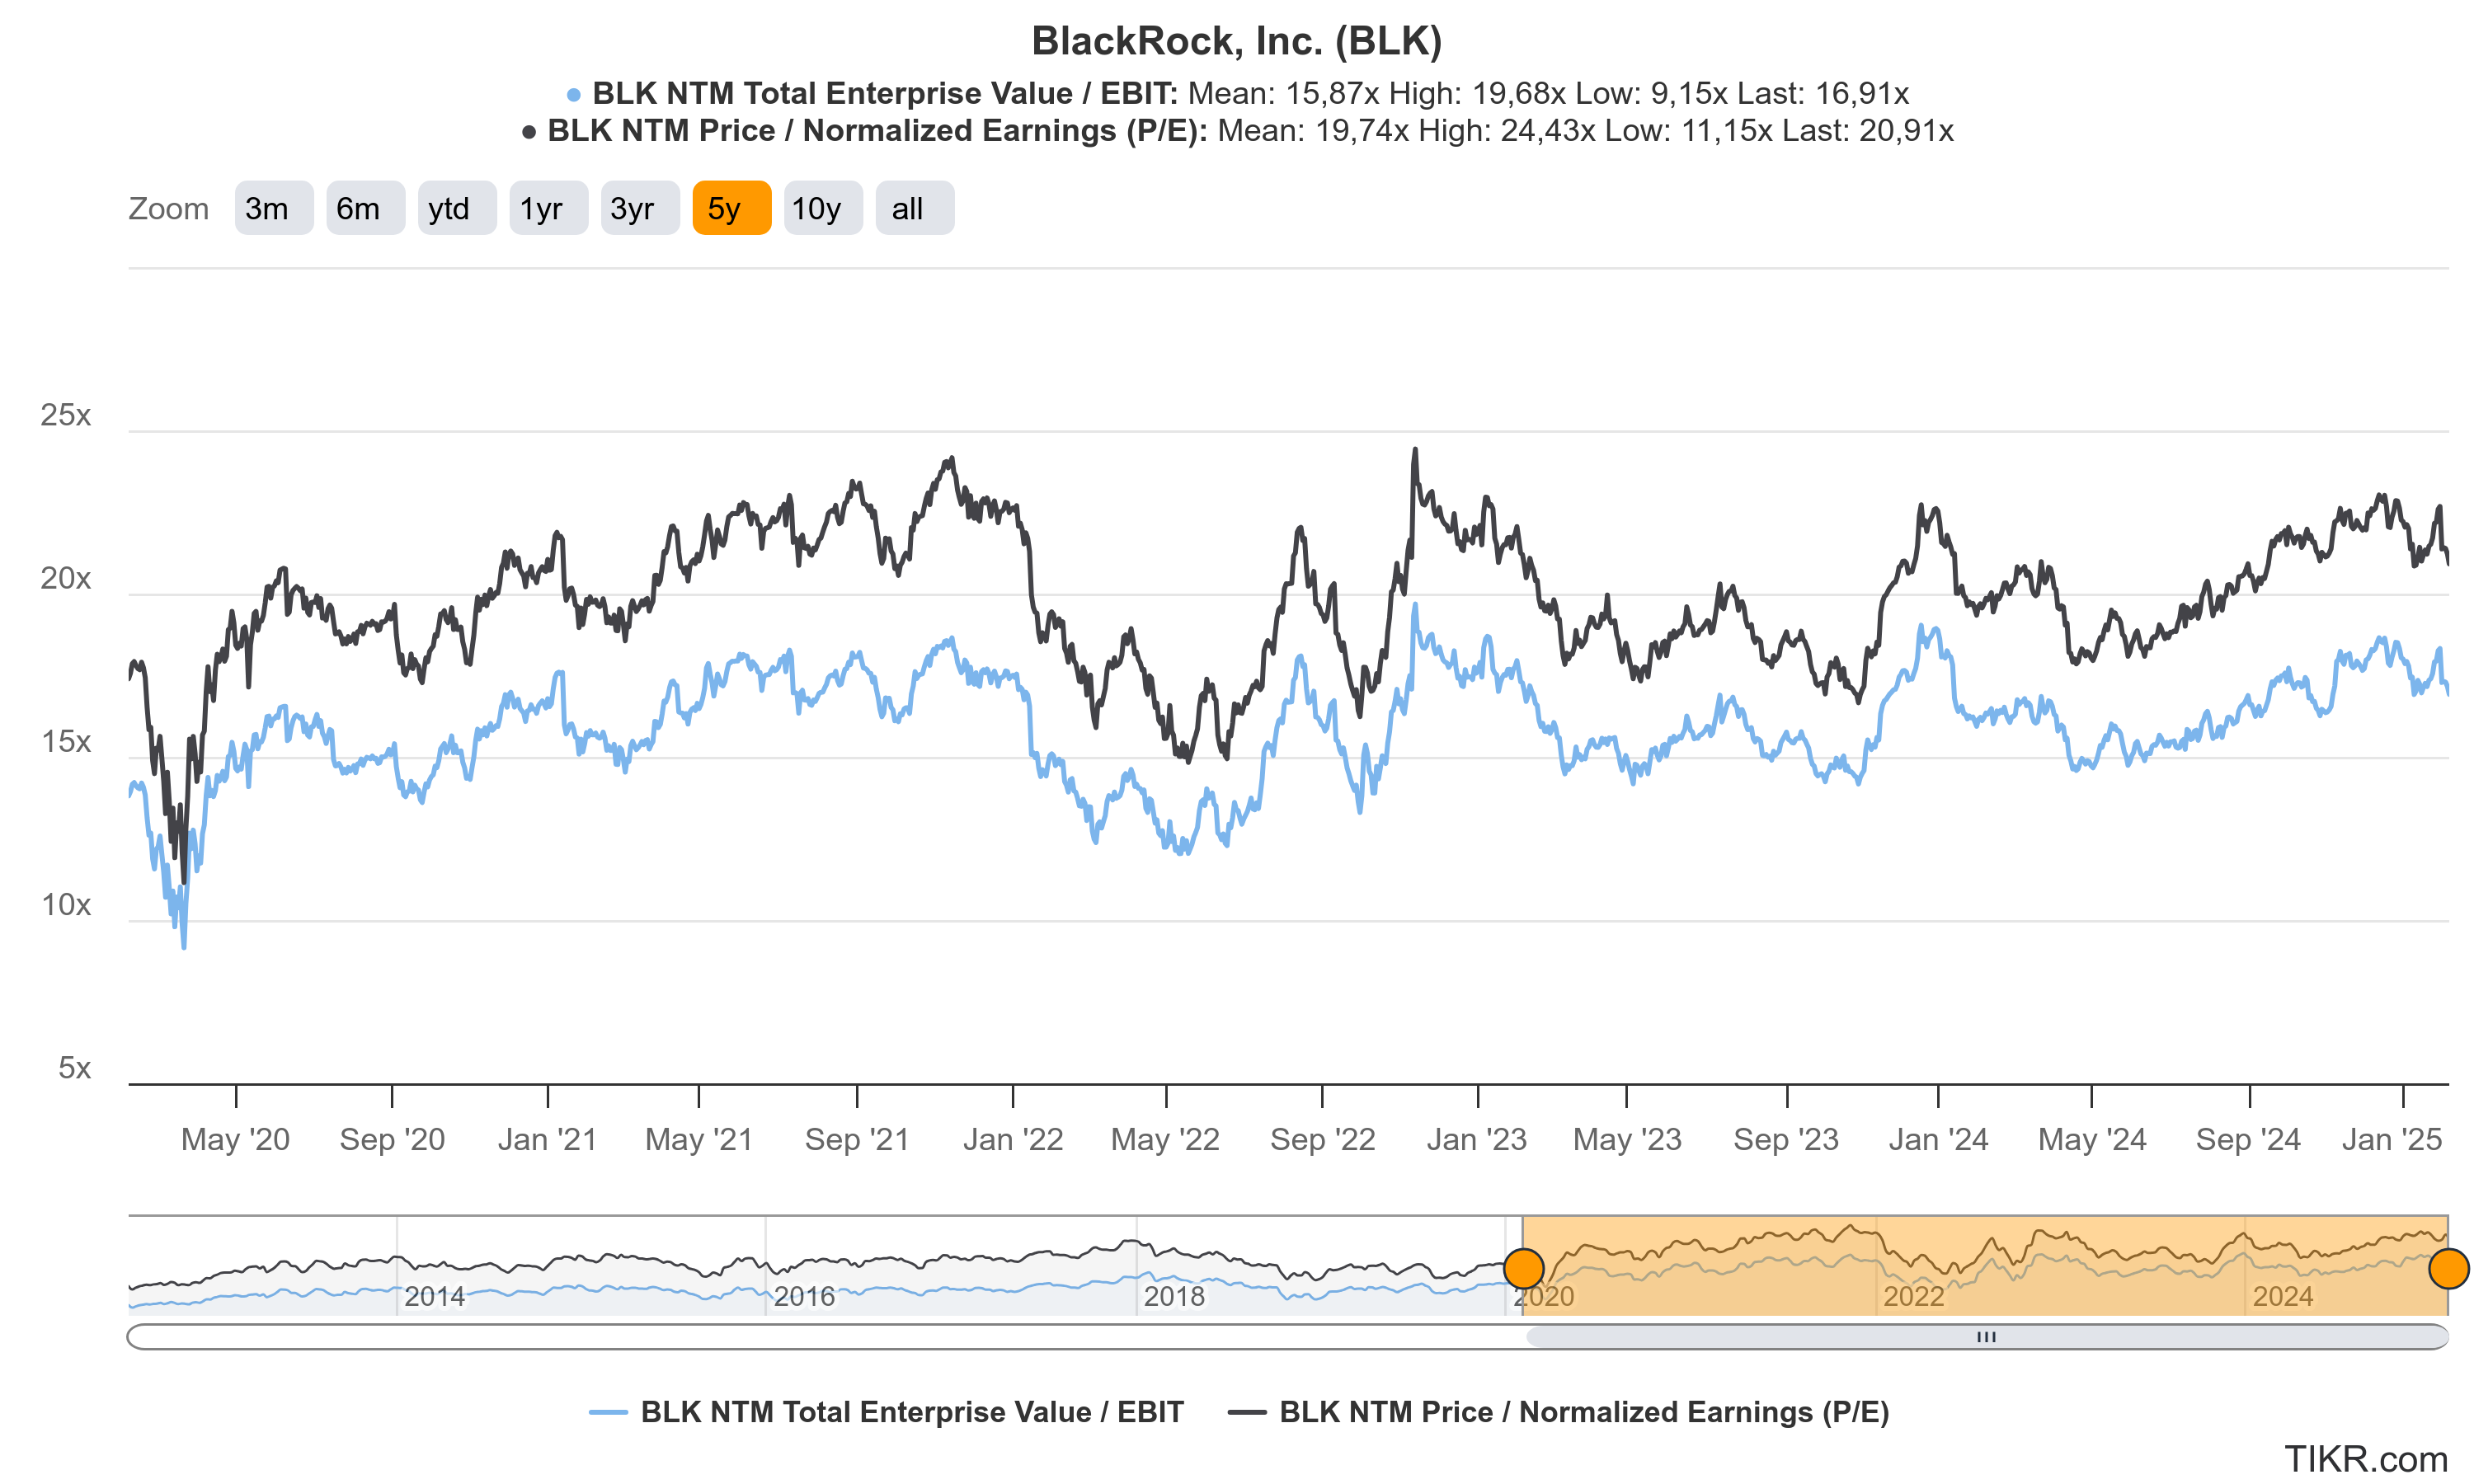
P/E and EV/EBIT
In addition to my DCF valuation, I analyzed the historical development of BlackRock’s P/E and EV/EBIT ratios. Currently, both ratios are slightly above their 5-year averages, with the P/E at 20.91x compared to the historical average of 19.74x, and the EV/EBIT at 16.91x versus 15.87x. This supports my assessment that the stock is slightly overvalued at the moment.
Dividends and share buybacks
BlackRock has a well-established dividend policy and share buyback program that reflect its strong commitment to returning capital to shareholders.
Dividend Policy
BlackRock consistently pays dividends, reflecting its strong free cash flow generation and solid financial performance. The company aims to deliver sustainable dividend growth over time, supported by its expanding earnings base. While specific payout ratios can vary depending on earnings growth and strategic investments, BlackRock maintains a history of steadily increasing its dividends, demonstrating confidence in its long-term profitability. The dividend yield stands at 2.2%

Share Buyback Program
BlackRock also actively engages in share repurchase programs as part of its capital return strategy. During the nine months ended September 30, 2024, BlackRock repurchased 1.6 million common shares for approximately $1.2 billion under its existing share buyback program. As of that date, approximately 4.2 million shares were still authorized for repurchase. The timing and volume of share repurchases depend on factors such as market conditions, stock price levels, and regulatory constraints.
Conclusion on Blackrock
BlackRock stands as the undisputed global leader in asset management, backed by its diversified business model, strong financial performance, and consistent ability to adapt to changing market dynamics. With over $11.6 trillion in assets under management, the company’s scale not only drives operational efficiency but also provides resilience across market cycles. Its broad product offerings, ranging from traditional equities and fixed income to alternative investments and cutting-edge technology solutions like the Aladdin® platform, ensure diversified revenue streams and long-term growth potential.
While BlackRock faces headwinds such as fee compression, competitive pressure, and market volatility, its strategic acquisitions, robust free cash flow generation, and shareholder-friendly capital return policies through dividends and share buybacks position it well for continued success. The company’s strong margins and impressive returns underscore its operational excellence, and despite current valuations suggesting a slight overvaluation, BlackRock’s growth prospects remain compelling over the long term.
For investors seeking exposure to a market leader with global reach, a solid growth trajectory, and a proven track record of navigating financial cycles, BlackRock represents a strong candidate. As always, it's essential to consider potential risks and conduct thorough due diligence when evaluating any investment.
Thank you once again for being here and for your interest! If you enjoyed my analysis, please consider leaving a "like" and subscribing. Your support means a lot!
Disclaimer: The information provided in this publication is for educational and informational purposes only and does not constitute financial advice. The content is solely reflective of my personal views and opinions based on my research and is not intended to be used as a basis for investment decisions. While every effort is made to ensure that the information is accurate and up-to-date, the writer makes no representations as to the accuracy, completeness, suitability, or validity of any information in this post and will not be liable for any errors, omissions, or delays in this information or any losses, injuries, or damages arising from its display or use. All readers are advised to conduct their own independent research or consult a professional financial advisor before making any investment decisions. The author is invested in the mentioned stock.
Very informative. Thank you!
Great writeup, well written with all the useful public informations