


#76 Pandora A/S - Part II
Analyzing Pandora's Financials

Dear Readers,
Thank you for being here and showing interest in my work! Your support means the world to me. If you enjoyed this article and would like to see more, please consider subscribing and giving it a like—it really helps grow our community of investors. Thank you for your continued support!
Please read the disclaimer at the end of this article. This is not an investment advice!
In Part II of the Pandora A/S analysis we will take a closer look at the financials. If you missed part I, here you go:

1. How are sales developing?
Since 2017, Pandora has achieved a compound annual growth rate (CAGR) of 4.8% in sales. Following the low point in 2020, the company rebounded strongly, delivering an impressive CAGR of 13.6%. Overall, Pandora has expanded its total sales by approximately 39%, reflecting its ability to drive sustained growth through brand repositioning, strategic network expansion, and strong consumer demand.

2. How did sales developed in detail?
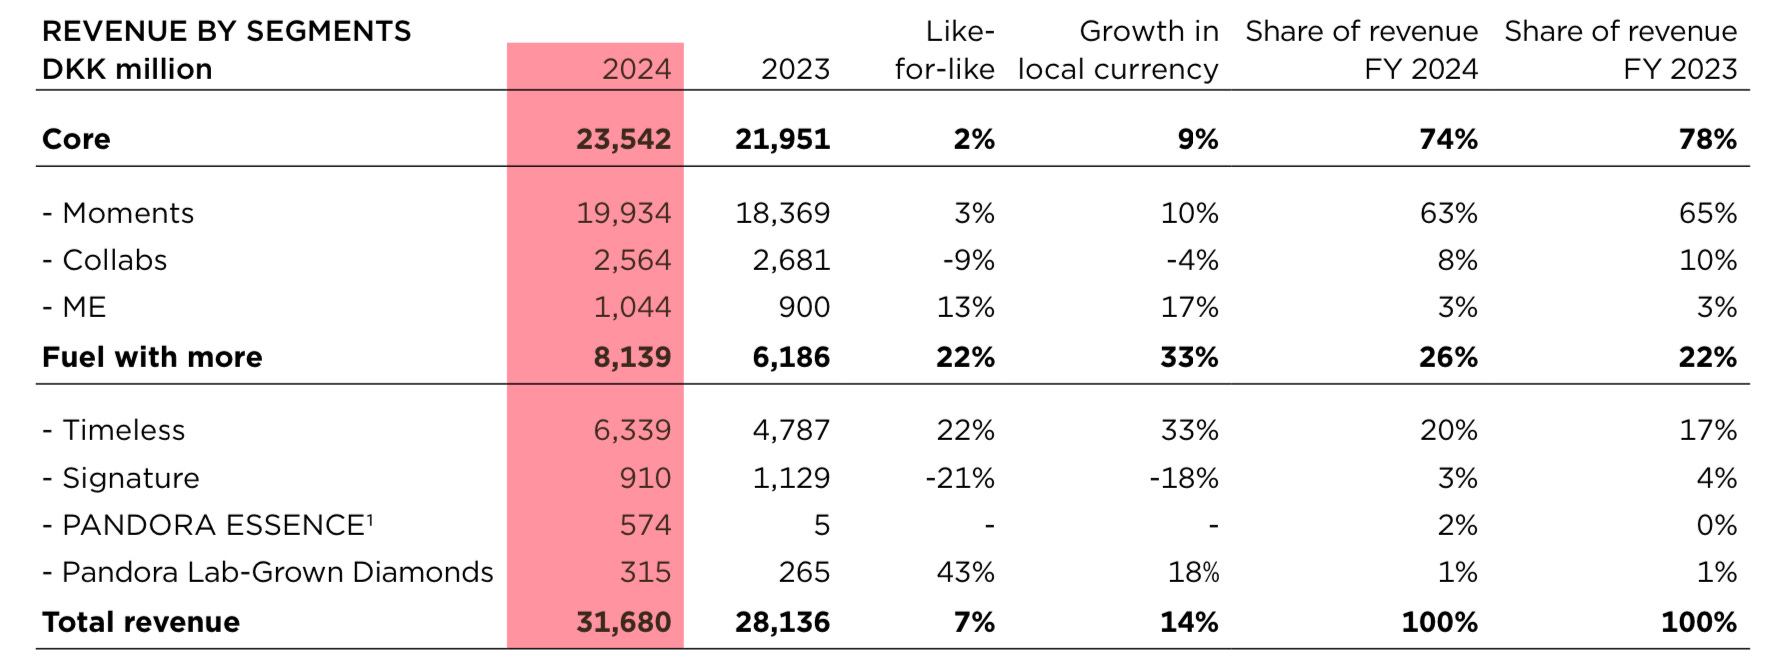
Pandora’s sales development varied across segments, reflecting its strategic shift toward a full jewelry brand. The Core segment, which includes Pandora Moments, Pandora ME, and Collabs, accounted for 74% of total revenue in 2024, with 2% like-for-like growth. While Pandora Moments remained strong with 3% growth, Pandora ME saw a 13% increase, driven by its appeal to younger consumers. However, Collabs declined by 9%, largely due to the high base effect from the 2023 Disney 100 collection.
The Fuel with More segment grew significantly, expanding its revenue share from 22% to 26%, with 22% like-for-like growth. Pandora Timeless led the way with 22% growth, benefiting from rising demand for elegant, everyday jewelry. The newly launched Pandora Essence collection quickly gained traction, while Pandora Lab-Grown Diamonds surged by 43%, supported by growing consumer interest in sustainable luxury.
This performance was driven by Pandora’s brand transformation, product diversification, store expansion, and targeted marketing efforts. While the Core segment remains stable, the rapid growth in Fuel with More underscores Pandora’s successful expansion beyond charms and into broader jewelry categories.
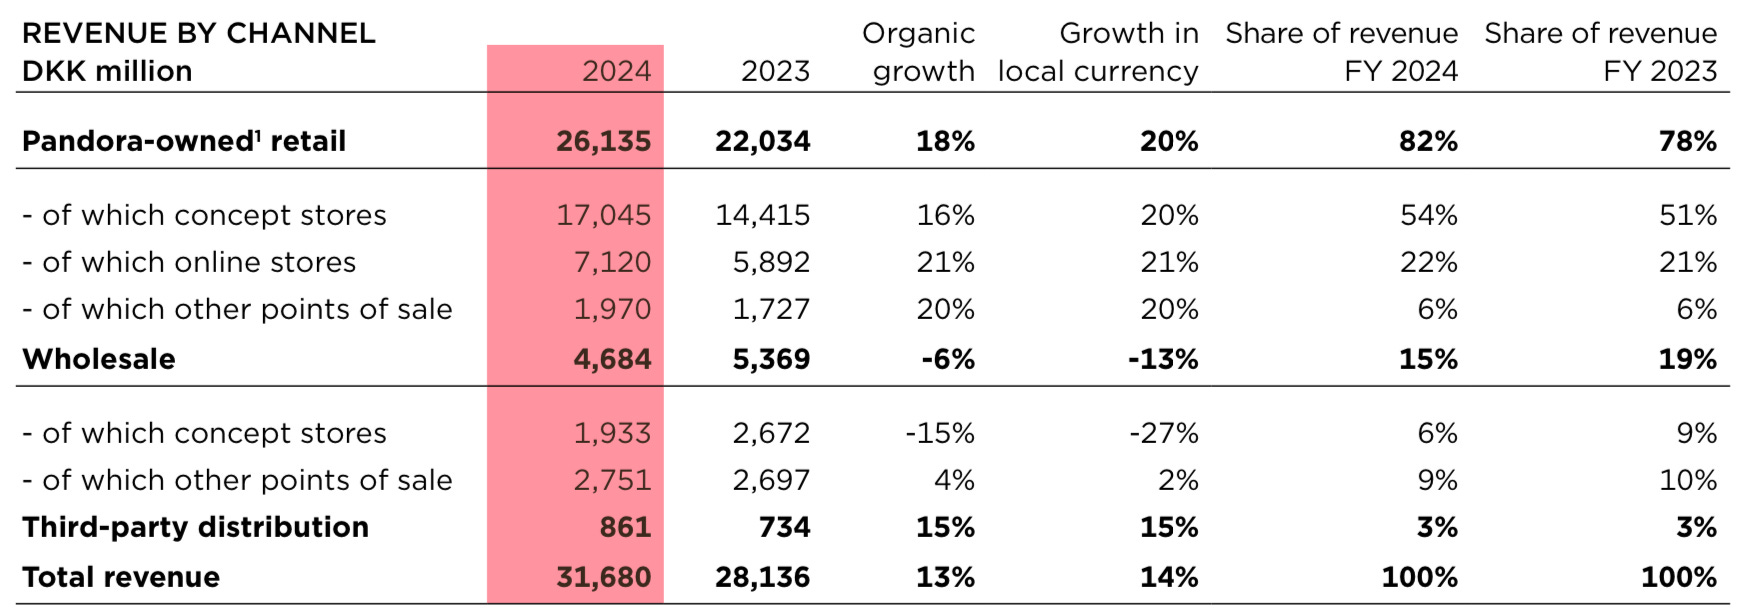
Pandora's sales development across channels highlights its strong direct-to-consumer strategy and ongoing shift towards owned and operated stores.
Sales through Pandora-owned retail stores grew significantly, reaching DKK 26.1 billion in 2024, an 18% increase from the previous year. This growth was driven by strong performance in concept stores (+16%) and a 21% rise in online sales, reflecting the success of Pandora’s digital expansion. The company continues to prioritize store network expansion and forward integration, acquiring more franchise stores to ensure brand consistency and better customer experience.
Wholesale and third-party distribution, however, declined by 6%, contributing DKK 4.7 billion, as Pandora focuses more on direct sales channels. The strategic reduction in reliance on external partners reflects Pandora's goal of maintaining tighter control over its brand, pricing, and customer engagement.
The growth in online sales (DKK 7.1 billion, +21%) showcases the success of Pandora’s e-commerce and omnichannel strategies, with continued investments in personalized marketing and digital platforms enhancing the customer experience.
Overall, Pandora’s shift towards a vertically integrated retail model, coupled with expanding digital capabilities, has been a key driver of its sales growth, improving profitability and brand control while reducing dependency on third-party distributors.
Pandora's sales development across key markets in 2024 showcased strong growth in the U.S. and Germany, while China and Australia struggled with weak consumer sentiment.
The U.S. remains Pandora’s largest market, contributing 31% of total revenue. Sales grew 8% like-for-like, driven by strong brand momentum, network expansion, and the success of the BE LOVE campaign. The acquisition of 36 partner stores and the opening of 37 new concept stores further fueled growth.
Germany was the standout performer in Europe, delivering 45% like-for-like growth, supported by higher brand penetration and an always-on media strategy. Meanwhile, France (-5%), Italy (-7%), and the UK (-2%) faced headwinds from weak consumer confidence, though Pandora’s brand positioning efforts are expected to yield future improvements.
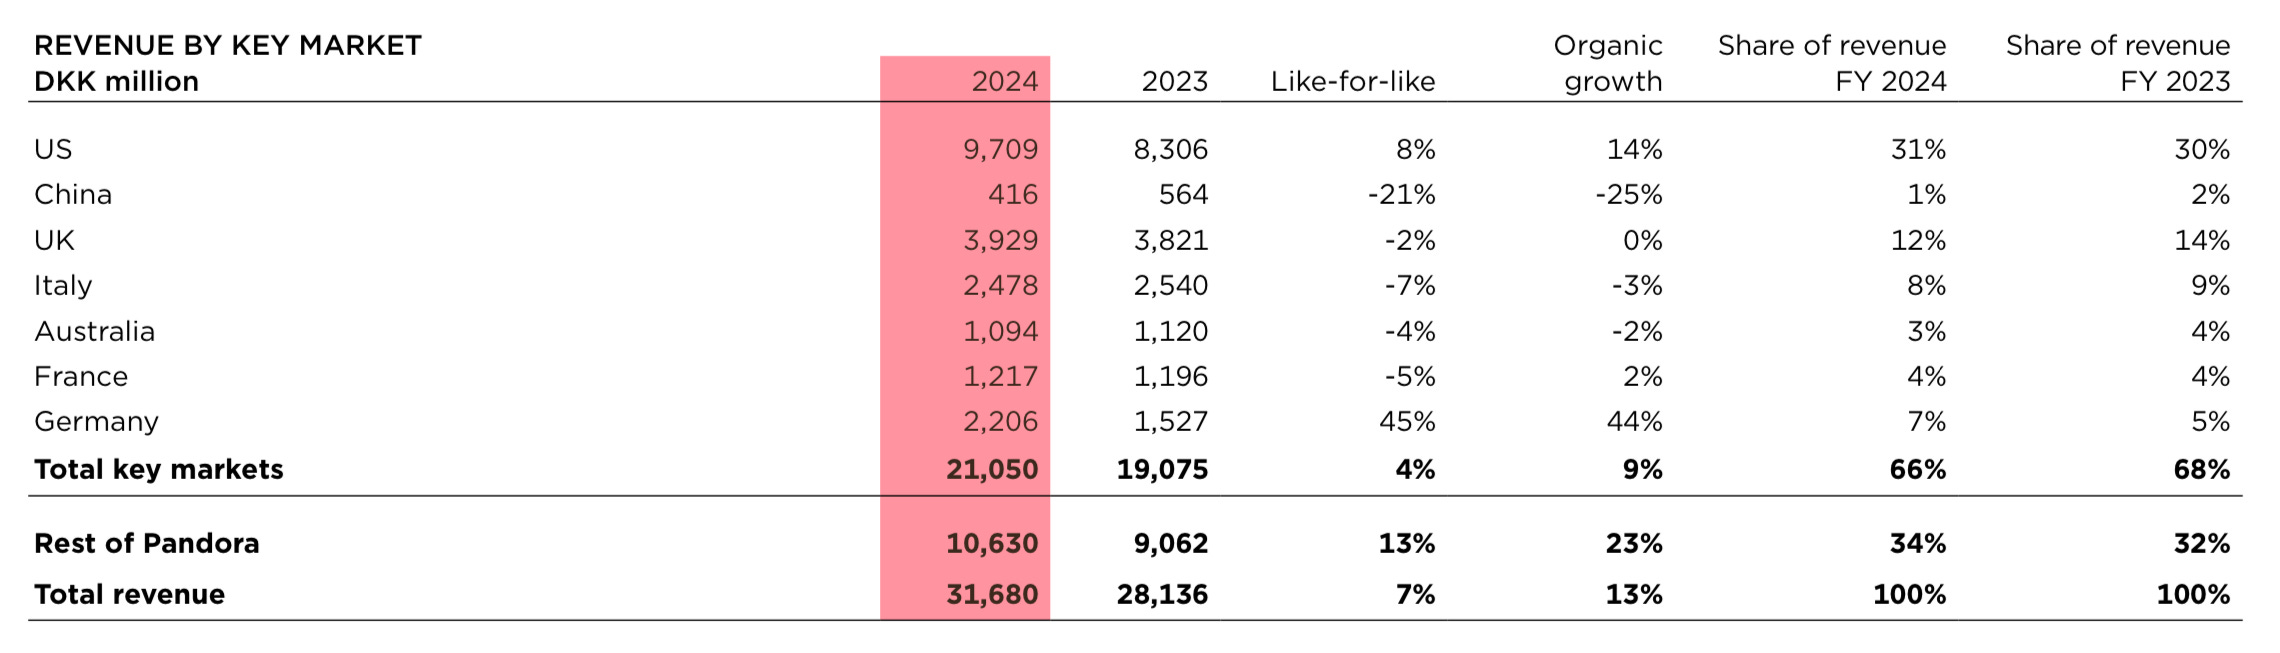
China continued to struggle, with a -21% like-for-like decline, as the post-pandemic recovery remained sluggish. Pandora initiated a brand relaunch in Shanghai, which showed promising early results, but the broader market remains challenging. As part of its strategy, Pandora plans to optimize its store network by closing at least 50 stores in China.
Rest of Pandora markets, including Spain, Mexico, Canada, and Poland, performed well, achieving 13% like-for-like growth, reflecting broad-based brand momentum and untapped potential in these regions. Mexico and Spain each generated approximately DKK 1.4 billion in revenue.
Overall, Pandora’s growth strategy in key markets has been centered around strengthening its brand, expanding store networks, and driving product innovation, while managing challenges in weaker-performing regions.
3. Is it growing organically or by aquisitions?
Pandora's growth strategy is primarily organic, driven by like-for-like sales growth, store network expansion, and brand repositioning. The company focuses on strengthening its core business through product innovation, digital transformation, and direct-to-consumer sales.
However, acquisitions also play a role, particularly in forward integration efforts. Pandora has been acquiring franchise stores to increase its share of owned and operated locations, ensuring greater control over pricing, branding, and customer experience. In 2024, the company acquired 36 partner stores in the U.S. and continues to evaluate opportunities for store takeovers as part of its network expansion.
Overall, while Pandora’s primary growth engine is organic, acquisitions of existing franchise stores support its strategic shift toward direct-to-consumer sales, enhancing profitability and brand consistency.
4. What is the managements forecast?
Pandora forecasts continued strong sales growth in 2025, with organic growth expected to reach 7-8% and total revenue projected to increase to DKK 34.3-34.6 billion. This growth will be driven by like-for-like sales expansion (4-5%), network expansion (+3%), and forward integration (+1%), though foreign exchange impacts will be marginal.
Pandora will continue executing its Phoenix strategy (2024-2026), which includes:
Expanding store networks, with plans to open 50-75 new concept stores and 25 Pandora-owned shop-in-shops.
Elevating brand positioning and enhancing its presence as a full jewelry brand.
Strengthening digital and omnichannel capabilities, further integrating personalization and e-commerce.
While macroeconomic uncertainties persist, Pandora remains optimistic about its growth trajectory, leveraging strong consumer demand, brand desirability, and strategic expansion efforts.
5. What are analysts expecting?
For 2025, analysts anticipate a revenue increase to DKK 34.8 billion, with projections surpassing DKK 40 billion by 2027, driven by strong organic growth, continued store expansion, and increasing brand penetration.
6. Is it profitable?
Pandora enjoys very high gross margins, which translate into high operating and net margins. It also has high returns on capital due to its optimized capital structure and asset-light model.
7. What are the major costs?
The major costs for Pandora include:
Raw Materials (Gold & Silver Prices) – A significant portion of Pandora’s costs comes from purchasing raw materials such as silver and gold. The company has been shifting to 100% recycled silver and gold, but price fluctuations in these commodities still impact costs.
Labor Costs – Pandora employs over 12,000 skilled craftspeople, and labor expenses, including salaries and benefits, are a key cost driver. The company has managed to offset local salary inflation through productivity improvements.
Crafting & Manufacturing Expenses – The company operates multiple crafting facilities, mainly in Thailand and Vietnam, with a growing production base. Crafting at scale is a core competitive advantage, but it requires capital expenditure and operational costs.
Retail & Store Network Expansion – Pandora continues to invest in concept stores and store refurbishments under the new EVOKE store concept. In 2024, Pandora expanded its retail network significantly, which added 5% incremental growth but also increased operational expenses.
Marketing & Brand Positioning – As part of the Phoenix Strategy, Pandora is heavily investing in brand awareness, advertising, and product innovation. The company has increased spending on global campaigns, PR efforts, and digital marketing.
Logistics & Supply Chain Costs – Costs related to distribution centers, international shipping, and customs duties are important, especially as Pandora expands geographically.
Technology & Digital Investments – The company is investing in e-commerce, digital personalisation, AI-driven customer engagement, and a new ERP system to improve operational efficiency and sales channels.
Sustainability Investments – Pandora has committed to carbon reduction initiatives, sustainability-linked bonds, and shifting to lab-grown diamonds. These initiatives require continuous investment in green energy, ethical sourcing, and recycling technologies.
Foreign Exchange & Inflation – Costs are impacted by currency fluctuations (USD, THB, and EUR), which affect raw material costs, labor costs, and international trade expenses. The company actively hedges against these risks.
Research & Development (R&D) – Pandora is investing in design innovation, new jewellery concepts, and advanced crafting techniques to stay ahead in the market.
8. What is driving costs?
Raw materials
Gold and silver prices significantly impact Pandora’s financial performance, as the company heavily relies on these precious metals for its jewelry production. In 2024, rising silver and gold prices were identified as a substantial headwind, expected to reduce the EBIT margin by approximately 210 basis points.
Pandora has taken measures to mitigate these cost increases. These include price adjustments and operational efficiencies to offset inflationary pressures, including salary increases. However, the company has acknowledged that commodity prices and foreign exchange rates will pose ongoing challenges throughout 2025.
Additionally, Pandora has fully transitioned to using 100% recycled silver and gold in its production, which aligns with its sustainability strategy and may help mitigate some cost pressures. Despite these challenges, Pandora’s strong brand positioning and strategic initiatives aim to sustain profitability and drive continued growth.
Labor costs
Labor costs are an important factor in Pandora’s financial performance, particularly given its large-scale, labor-intensive jewelry crafting operations. Here’s how labor costs are impacting the company:
Labor Costs as a Margin Headwind
Pandora has identified rising labor costs, including wage inflation, as a challenge. In 2024, it was noted that higher-than-normal salary increases were expected to suppress the EBIT margin by approximately 1.0 percentage point
Efficiency Gains Offsetting Cost Increases
Despite increasing wages, Pandora has managed to improve labor efficiency and productivity, which has helped offset some of the wage inflation. Over the past five years, the company has successfully reduced the average cost per unit produced, even as wages have increased. This has been achieved through:
Automation and process improvements in crafting facilities.
Workforce optimization through training and technology.
Scaling production facilities to benefit from economies of scale.
Strategic Labor Cost Management in Crafting & Supply
Pandora employs over 12,000 skilled craftspeople in its production facilities. It has implemented workforce management strategies, such as:
Training multi-skilled workers to increase flexibility.
Adjusting work hours and resources dynamically to align with demand fluctuations.
Expanding production to Vietnam, which offers competitive wages and a strong labor force, to diversify risks and potentially reduce overall labor costs.
9. What is the Gross margin?
Pandora has consistently maintained a high and stable gross margin, which is a key strength of its financial model. In 2024, the gross margin stood at 79.8%, an increase from 78.6% in 2023, reflecting the company’s ability to manage costs effectively while sustaining pricing power. Several factors contribute to this strong margin performance, starting with Pandora’s pricing strategy and brand strength. The company has successfully implemented price increases in recent years, leveraging its position in the affordable luxury segment to charge premium prices. Additionally, the ongoing transformation from a charms-focused business to a full jewelry brand, including lab-grown diamonds and finished jewelry collections, has supported profitability.
Another key driver is Pandora’s vertical integration, allowing it to control crafting, supply chain, and retail distribution, thereby improving cost efficiency and reducing dependency on external suppliers. The company has also focused on operational efficiencies, where automation and process improvements have led to a declining average cost per unit, even in the face of rising labor costs. This has helped mitigate inflationary pressures while sustaining profitability. Furthermore, Pandora’s channel mix optimization plays a critical role, as the shift towards more direct-to-consumer sales through owned and operated stores and e-commerce has improved margins by reducing reliance on wholesale partners.
Despite these advantages, Pandora faces several headwinds that could pressure margins. The rising cost of silver and gold is one of the most significant challenges, creating a 230 basis points (bp) headwind from silver and 30 bp from gold in 2024. However, Pandora has hedged 70% of its silver and gold consumption, providing some protection against further price volatility. Additionally, foreign exchange fluctuations, particularly in USD, GBP, and THB, have negatively impacted gross margins by approximately 70 basis points. Another challenge is wage inflation and operational costs, as labor expenses have been rising. Yet, Pandora has offset much of this impact through efficiency improvements and productivity enhancements in its crafting facilities.

Pandora's Cost of Goods Sold (COGS) is highly variable, with only a small fixed component, giving the company significant flexibility to adjust costs based on demand fluctuations. According to the latest financial disclosures, only around 4% of COGS is truly fixed, primarily related to depreciation expenses. This means that Pandora’s cost structure is largely scalable, allowing the company to maintain high gross margins and cost efficiency, even when facing external cost pressures.
The variable components of COGS primarily consist of raw materials, labor, and outsourced production costs. The largest cost drivers within COGS include:
Silver and gold: These metals are a major input, and their prices have fluctuated significantly, contributing to commodity-related cost pressures. However, Pandora hedges 70% of its silver and gold consumption, providing some cost predictability.
Labor costs: These are semi-variable, as Pandora adjusts workforce capacity and working hours to match demand. Additionally, automation and efficiency improvements in crafting facilities have helped offset rising wages.
OEM/ODM costs: Pandora outsources some production to third-party manufacturers (OEMs and ODMs), which introduces variable costs tied to outsourcing agreements.
Freight and logistics: Shipping costs fluctuate based on demand, fuel prices, and supply chain conditions. Pandora has optimized its distribution network to improve efficiency and control costs.
Overall, Pandora’s cost structure allows it to scale production up or down efficiently, helping protect profitability and margin stability, even in uncertain market conditions. The company continues to leverage operational efficiencies, pricing strategies, and supply chain optimizations to manage its cost base effectively.

10. What is the operating margin?
Last year: 25.2%
Average: 26.1%
High and low in the last years:
High: 34.2% in 2017
Low: 19.6% in 2020

11. What is the net income margin?
Last year: 16.5%
Average: 17.7%
High and low in the last years:
High: 25.3% in 2017
Low: 10.2% in 2020
12. What is the Return on Assets?
Last year: 18.8%
Average: 20.8%
High and low in the last years:
High: 33.1% in 2017
Low: 9.7% in 2020

13. What is the Return on Capital?
Last year: 38.1%
Average: 37.5%
High and low in the last years:
High: 50.0% in 2021
Low: 18.6% in 2020
14. How are the margins expected to develop in the future?
Looking ahead, Pandora expects to maintain a sustainably high gross margin, with projections exceeding 78% even at current silver and gold prices. The company is implementing 1-2% annual price increases to counter cost pressures, while continued cost optimizations and automation in crafting will further support margins. The expansion into Vietnam for production will help diversify costs and mitigate risks. Despite ongoing challenges, Pandora’s strong brand, direct-to-consumer strategy, and operational efficiencies position it well to sustain its industry-leading profitability.
Pandora’s operating margin (EBIT margin) remains a focal point for the company as it navigates cost pressures while continuing to invest in growth. In 2024, the EBIT margin stood at 25.2%, in line with expectations, despite significant headwinds from rising commodity prices and foreign exchange fluctuations. Looking ahead to 2025, Pandora has set an EBIT margin guidance of approximately 24.5%, reflecting another year of compounding growth, strategic investments, and cost-saving initiatives.
Several factors influence this margin outlook. On the positive side, Pandora’s scaling efficiencies, strong brand pricing power, and direct-to-consumer model continue to support high profitability. The company is investing heavily in its Phoenix growth strategy, which includes brand repositioning, store expansion, and digital transformation. While these initiatives require upfront spending, they are expected to drive long-term revenue growth and strengthen profitability. Additionally, ongoing operational efficiencies in crafting and supply operations have offset wage inflation, helping maintain cost discipline.
However, headwinds from commodity prices and foreign exchange rates are expected to weigh on margins in 2025, with silver and gold price increases alone estimated to reduce the EBIT margin by approximately 210 basis points. To counteract this, Pandora plans to implement pricing adjustments and operational cost efficiencies, which should help mitigate some of the impact. The company has also launched a cost-saving program that is expected to become structurally beneficial from 2026 onwards, though it will be neutral to the 2025 margin.
Despite these challenges, Pandora remains committed to maintaining strong profitability while investing in future growth. The company expects its store expansion strategy to contribute incremental EBIT margin improvements over time, and its continued transition to a full jewelry brand should drive higher-margin sales. Overall, while the 2025 EBIT margin guidance of 24.5% reflects near-term cost pressures, Pandora’s long-term margin trajectory remains robust, with expectations for stabilization and potential improvements as efficiencies take effect.
15. How much cash is the company generating?
Pandora demonstrates exceptional strength in cash generation. On average, 27% of its revenue is converted into operating cash flow, highlighting its efficient business model and strong profitability. Moreover, an impressive 97% of its operating income is consistently transformed into free cash flow, underscoring the company's disciplined capital management and ability to generate substantial shareholder returns. This high cash conversion efficiency reflects Pandora’s robust operational execution, tight cost controls, and low capital intensity, making it a highly cash-generative business

16. What is the free cash flow margin?
Last year: 23.3%
Average: 24.2%
High and low in the last years:
High: 29.5% in 2020
Low: 13.6% in 2022

17. How does the cash conversion cycle look like?
The cash conversion cycle of Pandora remains remarkably stable during normal business years, typically ranging between 66 and 78 days. This consistency underscores the efficiency of Pandora’s working capital management. The company maintains a well-structured supply chain and inventory turnover, ensuring that it effectively manages its receivables, payables, and inventory to optimize cash flow.
A shorter cash conversion cycle is beneficial as it indicates that Pandora efficiently moves inventory and collects receivables while delaying payables, thereby minimizing the time cash is tied up in operations. Given that Pandora operates in the jewelry industry, which involves significant raw material procurement (such as silver and gold), maintaining a steady and relatively short cash conversion cycle demonstrates effective supply chain and financial management.
This stability also reflects Pandora’s strong retail distribution model, including its well-optimized inventory management and demand forecasting capabilities. Furthermore, the company’s strategic focus on direct-to-consumer sales and a vertically integrated production model contributes to its ability to control working capital efficiently.

18. How did EPS developed?
EPS has grown at a CAGR of 3.2% since 2017. Since the low in 2020, it has grown at a CAGR of 34.2%.

19. What is the equity ratio?
Last year: 19.8%
Average: 30.6%
High and low in the last years:
High: 37.8% in 2021
Low: 19.8% in 2024

In absolute terms, Pandora's equity is decreasing due to share buybacks, while total assets are increasing due to higher business volumes.

20. How much debt does it have?
Pandora’s Capital Structure Policy is to maintain a leverage ratio (NIBD to EBITDA ratio) between 0.5x and 1.5x at year-end (including leases in accordance with IFRS 16). At 31 December 2024, the ratio was 1.1x (2023: 1.1x).

21. What is the Net debt/EBITDA ratio?
The latest net debt/EBITDA ratio is 0.65, which is considered very low.
22. What the interest coverage ratio?
The latest interest coverage ratio is 11.2, which is considered very good.
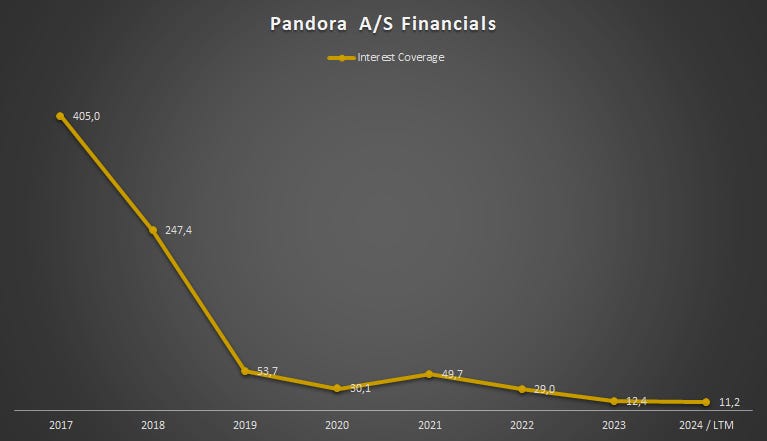
23. How did debt levels developed?
Debt levels are fairly constant over the analysis period and where significantly reduced during the cover years. In summary, it is striking that Pandora's debt levels are very consistently at a low level.

This is Part II of my new business analysis format. Part III, covering the capital allocation, investment thesis and valuation will be published soon—stay tuned!
Thank you once again for being here and for your interest! If you enjoyed my analysis, please consider leaving a "like" and subscribing. Your support means a lot!
Disclaimer: The information provided in this publication is for educational and informational purposes only and does not constitute financial advice. The content is solely reflective of my personal views and opinions based on my research and is not intended to be used as a basis for investment decisions. While every effort is made to ensure that the information is accurate and up-to-date, the writer makes no representations as to the accuracy, completeness, suitability, or validity of any information in this post and will not be liable for any errors, omissions, or delays in this information or any losses, injuries, or damages arising from its display or use. All readers are advised to conduct their own independent research or consult a professional financial advisor before making any investment decisions. The author is invested in the mentioned stock.