


#85 Allianz SE - Part II
Analyzing Allianz SE's Financials

In Part II of the Allianz SE analysis we will take a closer look at the financials. If you missed part I, here you go:

1. How are sales developing?
Allianz’s sales (also referred to as “total business volume”) have been on an upward trajectory over the past five years, reaching a record level in 2024. By 2024, Allianz achieved €179.8 billion in total revenues, up 11.2% year-on-year (11.9% on an internal basis). This strong 2024 growth was broad-based across segments, reflecting both price and volume increases and favorable market conditions.


2. How did sales developed in detail?
All core business segments contributed to Allianz’s revenue growth:

Property-Casualty (P/C) Insurance: In 2024, the P/C segment’s total business volume grew 8.3% internally to €82.9 billion. Growth was driven by higher premiums (both price increases and new business) across markets – for example, strong policy growth in commercial lines and rate increases to counter inflation. Over 2019–2023, P/C premiums showed steady organic growth (aside from a slight slowdown in 2020). The 5-year trend in P/C has been positive, with internal growth of 4–5% most years, accelerating in 2023–2024 on the back of hardening insurance rates and economic recovery. Notably, 2024’s growth in P/C exceeded the company’s outlook range of 5–7%, indicating robust demand.
Life/Health Insurance: Allianz’s life and health segment also expanded. In 2024, Life/Health revenues (defined as statutory gross premiums and fee income) reached €89.3 billion, exceeding management’s expected range of €73–83 billion. This was fueled by strong sales of capital-efficient and unit-linked products, especially in Asia and the U.S., as well as a rebound in savings products in Europe. The present value of new business premiums (PVNBP, a measure of sales volume) jumped 21.6% in 2024 to €81.8 billion, reflecting growth in almost all regions. Over 2019–2023, Life/Health sales showed more volatility: a slight contraction in 2020 (amid pandemic impacts on life insurance demand), followed by growth in 2021–2022. By 2023, life premiums had softened in some markets (e.g. lower single-premium policies in Germany and Italy), but this was more than offset in 2024 by a pivot to attractive products and new market expansion. Overall, the segment’s 5-year trend is one of refocusing on profitable, capital-light products, with 2024’s sales boost underscoring successful product strategy.
Asset Management: Allianz’s asset management arm (mainly PIMCO and AllianzGI) generates revenue from management fees. In 2024, asset management operating revenues were €8.3 billion, up slightly from €8.1 billion in 2023. Third-party Assets under Management (AuM) grew 12.1% in 2024 (to €1.996 trillion) due to positive market returns and net inflows. This followed a challenging 2022–2023 when market downturns and net outflows (especially at PIMCO) reduced fee income. Over the 2019–2021 period, asset management revenues rose steadily with rising AuM and performance fees, peaking in 2021. In 2022, revenues dipped as AuM fell on market volatility. By 2023, the segment stabilized, and 2024 saw a return to growth in AuM and fee income. While asset management contributes a smaller portion of Allianz’s total sales (roughly 5% of 2024 revenues), it provides a steady fee-based income stream that has trended upward over five years (CAGR in low single digits).
Geographically, Allianz’s growth in 2019–2024 was well distributed. Key markets like Germany, France, and the U.S. saw steady premium growth, while Asia-Pacific contributed strongly in Life/Health (notably through increased sales of fixed index annuities in the U.S. and unit-linked products in Asia. The company’s large diversified footprint means no single market overly dominates revenue, which helped overall sales remain resilient even when certain regions (or lines) faced headwinds (e.g. pandemic disruptions, low interest rates affecting life products).
Overall, sales are on a positive trend, with 2024 marking an all-time high. The strong top-line performance in 2023–2024 indicates that Allianz has emerged from earlier challenges (pandemic, low-rate environment) with momentum. The company’s emphasis on “selective profitable growth” – focusing on pricing discipline and customer-centric product offerings – is evident in the quality of revenue growth. Management has highlighted that Allianz’s customer-centric strategy is fueling growth, helping the Group build enduring client relationships and increase sales “pull” across its markets.
3. Is it growing organically or by aquisitions?
Allianz’s growth over the past five years has been predominantly organic, driven by increasing premiums, new business, and expansion of existing operations. The insurer has leveraged its global scale and brand strength to grow in core markets without relying excessively on M&A. That said, targeted acquisitions and portfolio actions have played a role in Allianz’s strategy to strengthen its position in key markets and product areas:
Here’s a list of major Allianz acquisitions from 2019 to 2024:
2024
TUA Assicurazioni S.p.A. (Italy): No purchase price disclosed.
2023
Innovation Group Holdings Ltd. (UK):
Purchase Price: Not explicitly stated; goodwill recognized: €270 mn.
Incontra Assicurazioni S.p.A. (Italy):
Purchase Price: Not explicitly stated; identifiable assets: €456 mn; goodwill: €40 mn.
2022
European Reliance (Greece):
Purchase Price: €207 mn.
simplesurance GmbH (Germany): No purchase price disclosed.
Aqua Holdings (Thailand): No purchase price disclosed.
2021
Aviva operations in Poland & Lithuania:
Purchase Price: €2.6 bn.
Aviva Italia S.p.A. (Italy):
Purchase Price: €330 mn.
Westpac General Insurance (Australia):
Purchase Price: €457 mn + €32 mn contingent consideration.
2020
SulAmérica Seguros de Automóveis e Massificados (Brazil):
Purchase Price: €524 mn.
ControlExpert Holding B.V. (Netherlands): No purchase price disclosed.
BBVA Allianz Seguros (Spain): No price disclosed (joint venture).
2019
LV= General Insurance (UK) and Legal & General General Insurance (UK):
Combined investment over the years leading to majority ownership; specific final price not stated.
Overall, acquisitions have contributed moderately to Allianz’s growth, but not dramatically altered the trajectory. For instance, the Aviva Poland deal and others provided incremental revenue (Poland added ~€1.5–2 billion premiums annually from 2022), but the bulk of the €37+ billion increase in total business volume from 2019 to 2024 came from internal business expansion. Allianz’s management emphasizes “smart growth,” indicating a preference to grow organically in existing markets and only pursue acquisitions that offer clear strategic fit and value creation.
Organic Initiatives: Allianz has been investing in digitalization and customer-centric initiatives to drive organic growth. Enhanced digital distribution, improved customer experience (reflected in high Net Promoter Scores), and cross-selling between insurance and asset management products have helped Allianz deepen its penetration without needing acquisitions. The company’s record customer and employee satisfaction levels in 2024 are cited as factors that will support sustainable organic growth going forward.
4. What is the managements forecast?
Allianz’s management provides an annual outlook, mainly centered on operating profit targets and key ratios, rather than explicit revenue or margin guidance. For 2024, management had initially guided an operating profit target of €14.8 billion (± €1.0 bn). The company significantly outperformed this guidance, delivering €16.0 bn OP in 2024. Looking ahead, Allianz is cautiously optimistic. For 2025, management targets an operating profit of €16.0 billion (± €1.0 bn) – essentially flat compared to 2024’s result, reflecting a prudent stance amid macroeconomic uncertainty. This guidance implies that Allianz expects to sustain its current high level of profitability, with potential for slight upside (the midpoint 16.0 bn is equal to 2024, but the ±€1 bn range leaves room for growth if conditions are favorable).
In terms of top line, while explicit revenue guidance isn’t given in numerical form, management’s commentary suggests continued growth in sales. For 2025, Allianz envisages “robust growth” especially in the P/C segment. The Group expects the insurance market premium growth to moderate slightly (given exceptionally strong pricing in 2023–24), but still remain positive. In the Property-Casualty segment, Allianz anticipates internal premium growth in the mid-single digits for 2025 (a bit slower than 2024’s nearly 12% internal growth, due to an assumption of fewer price increases). In Life/Health, management plans to continue focusing on capital-efficient products and new markets; while no numerical forecast was given for life volumes in 2025, the implication is for stable or modest growth after the exceptional 2024 spike. The Asset Management outlook is for a “moderate increase” in Assets under Management, assuming stable markets and net inflows – which would translate into low-single-digit revenue growth in that segment.
Key targets/forecasts communicated by management include: maintaining a combined ratio around 93–94% in P/C (they hit 93.4% in 2024), a new business margin in Life/Health that ensures profitable growth (2024’s new business margin was strong, benefiting from higher interest rates), and an asset management cost-income ratio near 61% (2024 actual was 61.1%). Management also forecasted a Core Return on Equity between 14% and 17%; 2024 came in at 16.9%. These indicate the company’s expectation to sustain high returns.
Additionally, Allianz’s Board has signaled confidence through increasing shareholder payouts – the dividend for 2024 is proposed at €15.40 per share (up 11.6%) – which implicitly reflects management’s positive outlook on future earnings and cash flows. In sum, management expects Allianz to maintain its growth momentum into 2025, albeit normalizing somewhat from the record 2024, with a focus on profitable underwriting and efficient capital use rather than chasing top-line at the expense of margin.
Allianz’s CEO Oliver Bäte has articulated that the company will “continue to translate the success of our customer-centric strategy into even higher sustainable, capital-efficient growth”. The strategy revolves around three levers: driving smart growth (through customer-centric innovation), reinforcing productivity (cost efficiency, digitalization), and strengthening resilience (capital and risk management) . The management forecast implicitly assumes execution on these fronts will yield steady growth in earnings. They also note the external environment: e.g. insurance industry outlook suggests slowing but still positive premium growth in P/C in 2025 and strong demand for life insurance (especially retirement products) in a rising rate environment. Allianz is positioning to capitalize on these trends per management’s commentary.
5. What are analysts expecting?
Financial analysts covering Allianz generally mirror the cautious optimism of management, expecting moderate growth in the coming years. According to consensus estimates, revenues are forecast to continue rising modestly after the big jump in 2024. Analysts project FY 2025 revenue around €181–182 billion, essentially a ~1% increase from 2024 . This suggests the market expects Allianz’s premium growth to normalize (from 11% in 2024 to low single digits in 2025) as pricing tailwinds ease. For 2026–2027, current analyst models show revenues climbing to ~€185.5 billion in 2026 and ~€193.9 billion in 2027, indicating an annual growth rate of roughly 2–5% in those years. In other words, analysts see Allianz maintaining a steady upward sales trend, but at a gentler pace than 2024.
On the earnings side, analysts are expecting Allianz to remain solidly profitable and to grow its bottom line in line with or slightly above revenues. Consensus forecasts put 2025 net income at approximately €10.7 billion (attributable to shareholders), which is about +8% versus the €9.93 billion earned in 2024. Further out, 2026 net income is forecast around €11.4 bn and 2027 near €12.0 bn – implying mid-single-digit percentage earnings growth each year. These forecasts suggest analysts expect Allianz to achieve incremental improvements in efficiency or mix that allow net profit to grow a bit faster than revenue. In terms of EPS, this translates to an expected continued rise (helped also by share buybacks reducing share count): 2025 EPS is estimated in the high €20s (vs €25.20 in 2024) and reaching low €30s by 2027, according to various analyst reports.
Operating Profit and Segment Expectations: Sell-side analysts typically forecast operating profit around the midpoint of management’s guidance. For 2025, that means ~€16.0 bn (flat year-on-year). Many analysts have noted that Allianz tends to guide conservatively and then outperform; indeed, some have penciled in a slight beat (e.g. €16.2 bn OP for 2025) given the company’s track record. By segment, analysts expect P/C insurance to continue delivering the bulk of earnings – with combined ratio improvements possibly driving a bit more underwriting profit (consensus combined ratio for 2025 is ~93% vs 93.4% in 2024). Life/Health earnings are projected to be stable to slightly up, as higher investment income (from invested premiums, due to higher interest rates) could offset any moderation in volume. Asset Management is forecast to see a rebound in net inflows, which, combined with market recovery, would grow AuM and fee income; however, margin pressures (fee compression, competition) are expected to keep Asset Management operating profit growth modest (low-single-digit growth).
6. Is it profitable?
Yes – Allianz is consistently profitable, with strong earnings generation even in challenging years. Over 2019–2024, Allianz’s net income attributable to shareholders ranged from about €6.6–9.9 billion per year, with 2024 marking a record high. In 2024, net income was €10.54 billion (total, including minorities), of which €9.93 billion was attributable to shareholders. This was up ~16% from 2023’s €8.54 billion attributable profit, reflecting improved operating results and lower one-off charges. Allianz’s profitability is also evident in its healthy margins and return metrics (discussed in the next section). The company’s core operations – underwriting insurance and managing investments – have yielded robust operating profits annually: for instance, operating profit in 2024 was €16.0 billion (an all-time high), and it has remained above €10 bn even in downturns (e.g. ~€10.8 bn in 2020, when the pandemic caused higher claims and investment volatility).

7. What are the major costs?
In the insurance business, the largest costs are related to claims and benefits paid to policyholders and the reserves set aside for future claims. Under IFRS 17 (new accounting standard), Allianz reports “insurance service expenses” which encompass claims incurred, policyholder benefits, and associated servicing costs. In 2024, insurance service expenses were €82.1 billion against €97.7 billion of insurance revenue, indicating that roughly 84% of earned premiums went to pay claims, benefits, and related costs. Another way to view this is via the combined ratio in P/C insurance, which combines loss costs and expenses: Allianz’s combined ratio was 93.4% in 2024, meaning for every €100 of P/C premium earned, about €93.4 was consumed by claims and expenses, leaving €6.6 of underwriting profit. This was an improvement from prior years (2019–2023 combined ratios ranged roughly 94–97%, with 93.8% in 2023 on an IFRS17 basis), showing cost discipline and favorable loss experience.
Breaking down Allianz’s cost structure:
Claims and Insurance Benefits: This is by far the biggest cost bucket. In 2024, net claims and benefits (including maturities, surrenders in life insurance, etc.) account for tens of billions. For the P/C segment alone, gross claims incurred were roughly 69.3% of premiums in 2024. Major drivers of claims cost include natural catastrophe losses (e.g. storms, floods), large man-made losses, and general claim frequency/severity in auto, property, liability lines. In 2024, cat losses were actually lower than the prior year, helping to keep the loss ratio flat despite inflation. In life insurance, benefits and change in reserves are also a huge cost – these move with policy crediting rates and assumptions.
Acquisition and Commission Expenses: Allianz incurs significant costs to acquire business – agent commissions, broker fees, and other sales expenses. In 2024, acquisition and administrative expenses were €10.16 billion, and fee and commission expenses were €5.98 billion. Together, these ~€16 billion represent the cost of acquiring and servicing insurance contracts and investment products. These costs have grown moderately over the years in line with premium volume, but Allianz has kept them in check relative to revenue (the P/C expense ratio was ~24.1% in 2024, slightly up from 23.7% in 2023) – reflecting productivity gains and scaling of digital channels.
Operating Expenses (Admin and Other): Beyond acquisition costs, Allianz has general administrative expenses (staff salaries, IT, marketing, etc.). Included in the €10.16 bn above are such admin costs. Allianz also reports “other expenses” (which were €421 million in 2024) and “amortization of intangibles” (€296 million), as well as “restructuring and integration” charges (€700 million) for efficiency programs. These are smaller in magnitude but notable. For instance, Allianz has been investing in restructuring (e.g. combining certain country operations, updating systems) – €700 million restructuring cost in 2024 indicates ongoing efforts to streamline operations (which should reduce future costs).
Interest Expenses: Allianz has debt (subordinated and senior bonds) and thus incurs interest costs. However, relative to the size of the business, interest expense is not major. In 2024, interest expenses on external debt were €762 million. This cost inched up from €631 million in 2023 due to higher interest rates on newly issued debt. Still, interest expense is a small fraction of operating profit, and Allianz’s large investment portfolio generates far more interest income than its debt costs (the net interest result was strongly positive).
In summary, the cost of claims (losses and benefits) is the dominant expense, followed by distribution costs (commissions) and administrative expenses. Together, these make up the majority of the combined ratio or expense ratio that analysts watch. Allianz’s total operating costs (which we can approximate as insurance service expenses + commissions + G&A) have grown in absolute terms with the business, but the Group has managed to keep them proportionate to revenue. For example, the expense ratio in P/C has held around 28–29% (under IFRS 4; under IFRS 17 it’s embedded in the insurance service result), and the cost-income ratio in Asset Management was 61.1% in 2024 (essentially flat vs 61% target), indicating efficient cost control in that segment.
8. What is driving costs?
Several factors drive Allianz’s cost base:
Claims Inflation and Catastrophes: A key driver is inflation in claims costs – e.g. rising car repair costs, higher medical inflation, construction cost inflation for property claims. 2022–2023 saw high inflation globally, which put upward pressure on claims payouts. Allianz responded with pricing adjustments, but there’s usually a lag, so claims costs did rise. Conversely, higher interest rates help on the life side by reducing required reserves (under IFRS17 finance effects) and increasing investment income to fund claims. Catastrophe losses (weather events) can swing costs year to year; 2022 had above-average cat losses (like European storms), whereas 2024 had fewer such events, easing claim costs.
Business Growth and Mix: As Allianz writes more business, absolute costs rise. For example, writing more premiums means more commissions paid out. Changes in business mix also affect cost ratios: shifting toward more profitable lines (like liability insurance or protection products) can lower the loss ratio; selling more through direct channels can reduce commission expense. Allianz’s push of capital-light life products reduces the need to set aside huge reserves (a “cost” in a sense), thereby improving the cost profile.
Investments in Technology and Restructuring: Allianz has been spending on IT upgrades, digital platforms, and restructuring inefficient operations. These initiatives cause short-term costs (like the €700 mn restructuring charge in 2024), but they are aimed at reducing long-term operating expenses. For instance, Allianz is consolidating certain back-office functions and IT systems across Europe to eliminate duplication – this drives near-term expense but will lower administrative costs and improve the expense ratio in the future.
Regulatory and Legal Factors: The company incurred significant legal/provision costs in recent years (not regular operating cost, but notable). The Structured Alpha fund settlement in 2022 (Allianz paid over $6 billion to resolve U.S. legal claims) was a one-off that impacted net income and cash outflows in 2022–2023. Such items are non-recurring but do show up as expenses (either operating or non-operating). Excluding these, Allianz’s underlying cost trend is more stable. Additionally, compliance with new regulations (like IFRS 17 implementation, sustainability reporting) requires investments in systems and processes, adding to overhead.
In conclusion, Allianz’s cost base is well-managed, with major costs driven by predictable factors like claims and commissions. The insurer’s scale gives it some advantage – for instance, global reinsurance arrangements and purchasing power help control claims volatility, and efficiency programs spread fixed costs over a huge revenue base. The improvement in the combined ratio to 93.4% in 2024 from ~95% a few years ago demonstrates that Allianz has been able to bend the cost curve downward slightly, even as inflation surged, by pricing adequately and cutting expenses. Management’s focus on productivity (digitization, simplification) is aimed at offsetting external cost pressures (like inflation) going forward.
9. What is the Gross margin?
In an insurance context, “gross margin” can be interpreted as the margin after direct costs of providing insurance (claims and benefits). Under IFRS 17, Allianz’s insurance service result provides insight into this margin. In 2024, Allianz had Insurance revenue of €97.7 bn and insurance service expenses of €82.1 bn, yielding an insurance service result of €12.3 bn. This implies a gross margin of roughly 12.6% on the insurance business (12.3/97.7). In 2023, the comparable margin was ~12.4%, so there was a slight improvement. Another way: the P/C loss ratio was 69.3% and expense ratio ~24.1%, so the underwriting margin was ~6.6% in 2024. Adding net investment income allocated to insurance operations boosts the effective gross margin on the P/C segment. Overall, Allianz’s gross margin on its risk-taking activities tends to be in the low teens percent – which is normal for a large multi-line insurer, reflecting that ~85–90% of premium dollars go to pay policy costs. Over 2019–2024, gross margins have been relatively stable. Slight dips occurred in heavy loss years (e.g. 2020 saw a high combined ratio ~97% due to COVID claims and catastrophes, compressing margin to ~3%, but that was offset by lower driving claims in lockdowns), whereas favorable periods (2021–2022 pre IFRS17, margin ~5–6% underwriting plus investment) and the IFRS17 restatement show gross service margins around 12%. The introduction of IFRS 17 in 2023 changed the way revenue is measured (reducing “revenue” but not changing actual profit), so the percentage margins appear higher post-2022; the important point is Allianz maintained healthy underwriting profitability throughout the five-year period, evidenced by combined ratios consistently below 100%.
10. What is the operating margin?
Using Allianz’s total business volume, the operating margin was about 8.9% in 2024 (€16.0 bn OP on €179.8 bn revenue) and ~8.8% in 2023 (€14.7 bn on €161.7 bn). This indicates a slight uptick. If we instead use IFRS-reported revenue (which was ~€108 bn in 2024 on the income statement, excluding deposits), the operating margin would be higher (~14.8%). But for consistency, using the business volume: Allianz’s operating margin has ranged roughly 7%–10% in recent years. It dipped in 2020 when operating profit fell (OP margin ~7.7% on €140.5 bn revenue) but rebounded strongly by 2021 (~9.0%). The margin stayed solid through 2022–2024 around 8–9%. The stability of the operating margin underscores Allianz’s ability to increase profits in line with revenue – cost ratios and loss ratios have not materially eroded overall margin. In fact, 2024’s slight improvement was due to both underwriting gains and higher investment results. For example, higher interest rates increased Allianz’s operating investment income, contributing to profit without a corresponding increase in “revenue” under IFRS (since much investment income is classified below insurance revenue). This dynamic helped lift the effective OP margin.
11. What is the net income margin?
For 2024, the net margin was approximately 5.9% (€10.54 bn / €179.8 bn) as mentioned. In 2023 it was ~5.6%, and in 2022 ~4.7% (using €7.2 bn net on €152.7 bn). The net margin saw a dip in 2020–2021 (~4–5%) due to pandemic impacts and the Structured Alpha litigation charge which dragged 2021 net income down. The rebound in 2022–2024 brought net margin back up. Over the five-year span, Allianz’s net margin has averaged around 5%, which is reasonable given the industry (insurance is high volume, low margin by nature). The trend is upward recently: 2024’s net margin is the highest of the period, thanks to record earnings and strong cost control. This upward trajectory is expected to continue modestly – analysts see net margin creeping over 6% in coming years as net income grows slightly faster than premiums (also, share buybacks boost EPS but not margin). It’s worth noting that Allianz’s core net margin excluding one-offs is a bit higher; for instance, excluding the one-time legal settlement in 2021–2022, those years’ margins would have been closer to normal.
12. What is the Return on Assets?
Return on Assets (ROA): Allianz’s Return on Assets is modest, reflecting the large asset base needed to support insurance liabilities. At end of 2024, Allianz had total assets of €1.0446 trillion. Using net income €10.54 bn, ROA ≈ 1.0% for 2024. In 2023, assets were €0.9832 trillion and net income €9.03 bn, giving ROA ≈ 0.92%. This slight rise in ROA indicates better utilization of assets in 2024 (helped by higher investment yields). Over five years, ROA has hovered around 0.8% to 1.0%, which is typical for large insurers (who carry huge investment portfolios against liabilities). Insurance companies inherently have low ROA because the asset base includes policy reserves investments that generate low-risk, low-yield income. What matters is that ROA is positive and relatively stable – which it is for Allianz, aside from minor dips when earnings fell in 2020–2021. The uptick to ~1% in 2024 is a positive sign.

13. What is the Return on Capital?
Allianz’s return on capital can be interpreted as return on equity (since equity is the primary capital for insurers; one might also consider return on total capital including debt). The Return on Equity (RoE) for Allianz (on core net income basis) was 16.9% in 2024. Even on a reported basis, using shareholders’ equity €60.3 bn and net income to shareholders €9.93 bn, RoE comes out ~16.5%. This is a strong RoE, well above pre-2021 levels. For context, Allianz’s RoE was around 12% in 2019, dropped to ~8% in 2020–2021 (impacted by abnormal losses), recovered to ~10% in 2022, and then jumped to the high teens in 2023–2024. The five-year average RoE is roughly 14%, which indicates very solid profitability relative to equity.

14. How are the margins expected to develop in the future?
Combined Ratio / Gross Margin: Allianz aims to keep the P/C combined ratio in the low 90s. The outlook for 2025 combined ratio is ~93% again. If achieved, that would maintain the underwriting margin around 6-7%. There is potential upside if loss trends are benign (every 1% improvement in combined ratio directly expands margin). Conversely, if inflation or cats spike, margin could compress – but Allianz’s pricing and reinsurance strategy provides resilience. In Life, the margin (e.g. new business margin) is expected to hold up given high interest rates allow more spread. Overall, gross margins should remain around current levels; Allianz is not sacrificing pricing for volume, so underwriting discipline should protect the margin.
Operating Margin: With operating profit targeted to be flat in 2025 on slightly higher revenue, the OP margin might dip by a few tenths of a percent (from 8.9% to ~8.8%). Beyond that, consensus expects a mild rise in OP margin by 2026–27 as efficiency gains kick in (operating profit growing a bit faster than revenue). Essentially, Allianz’s ongoing efficiency programs (e.g. automation, reduced real estate footprint, shared services) are aimed at lowering the expense ratio, which would improve operating margins. Additionally, if investment income stays strong, it could boost OP without corresponding “revenue,” subtly lifting margin. Analysts thus foresee stable to slightly higher operating margins in the next 2-3 years, barring any major claim shocks.
Net Margin and ROE: As one-off charges subside (the last big one was Structured Alpha in 2021–2022) and operating performance stays robust, net margin should track operating margin. The expectation is net margin could inch above 6% in coming years. For instance, consensus net income growth (+6–7% annually) versus revenue growth (+2–4%) implies net margin rising to ~6.5% by 2027. ROE is projected to remain around mid-teens. Management’s target range is 13–16% core RoE through the cycle; with current levels at the high end, some analysts caution RoE might normalize down slightly if financial markets weaken. However, continued earnings growth and share buybacks (which reduce equity) are supportive of high ROE. In fact, one could see ROE staying ~17% if net income grows and excess capital is returned.
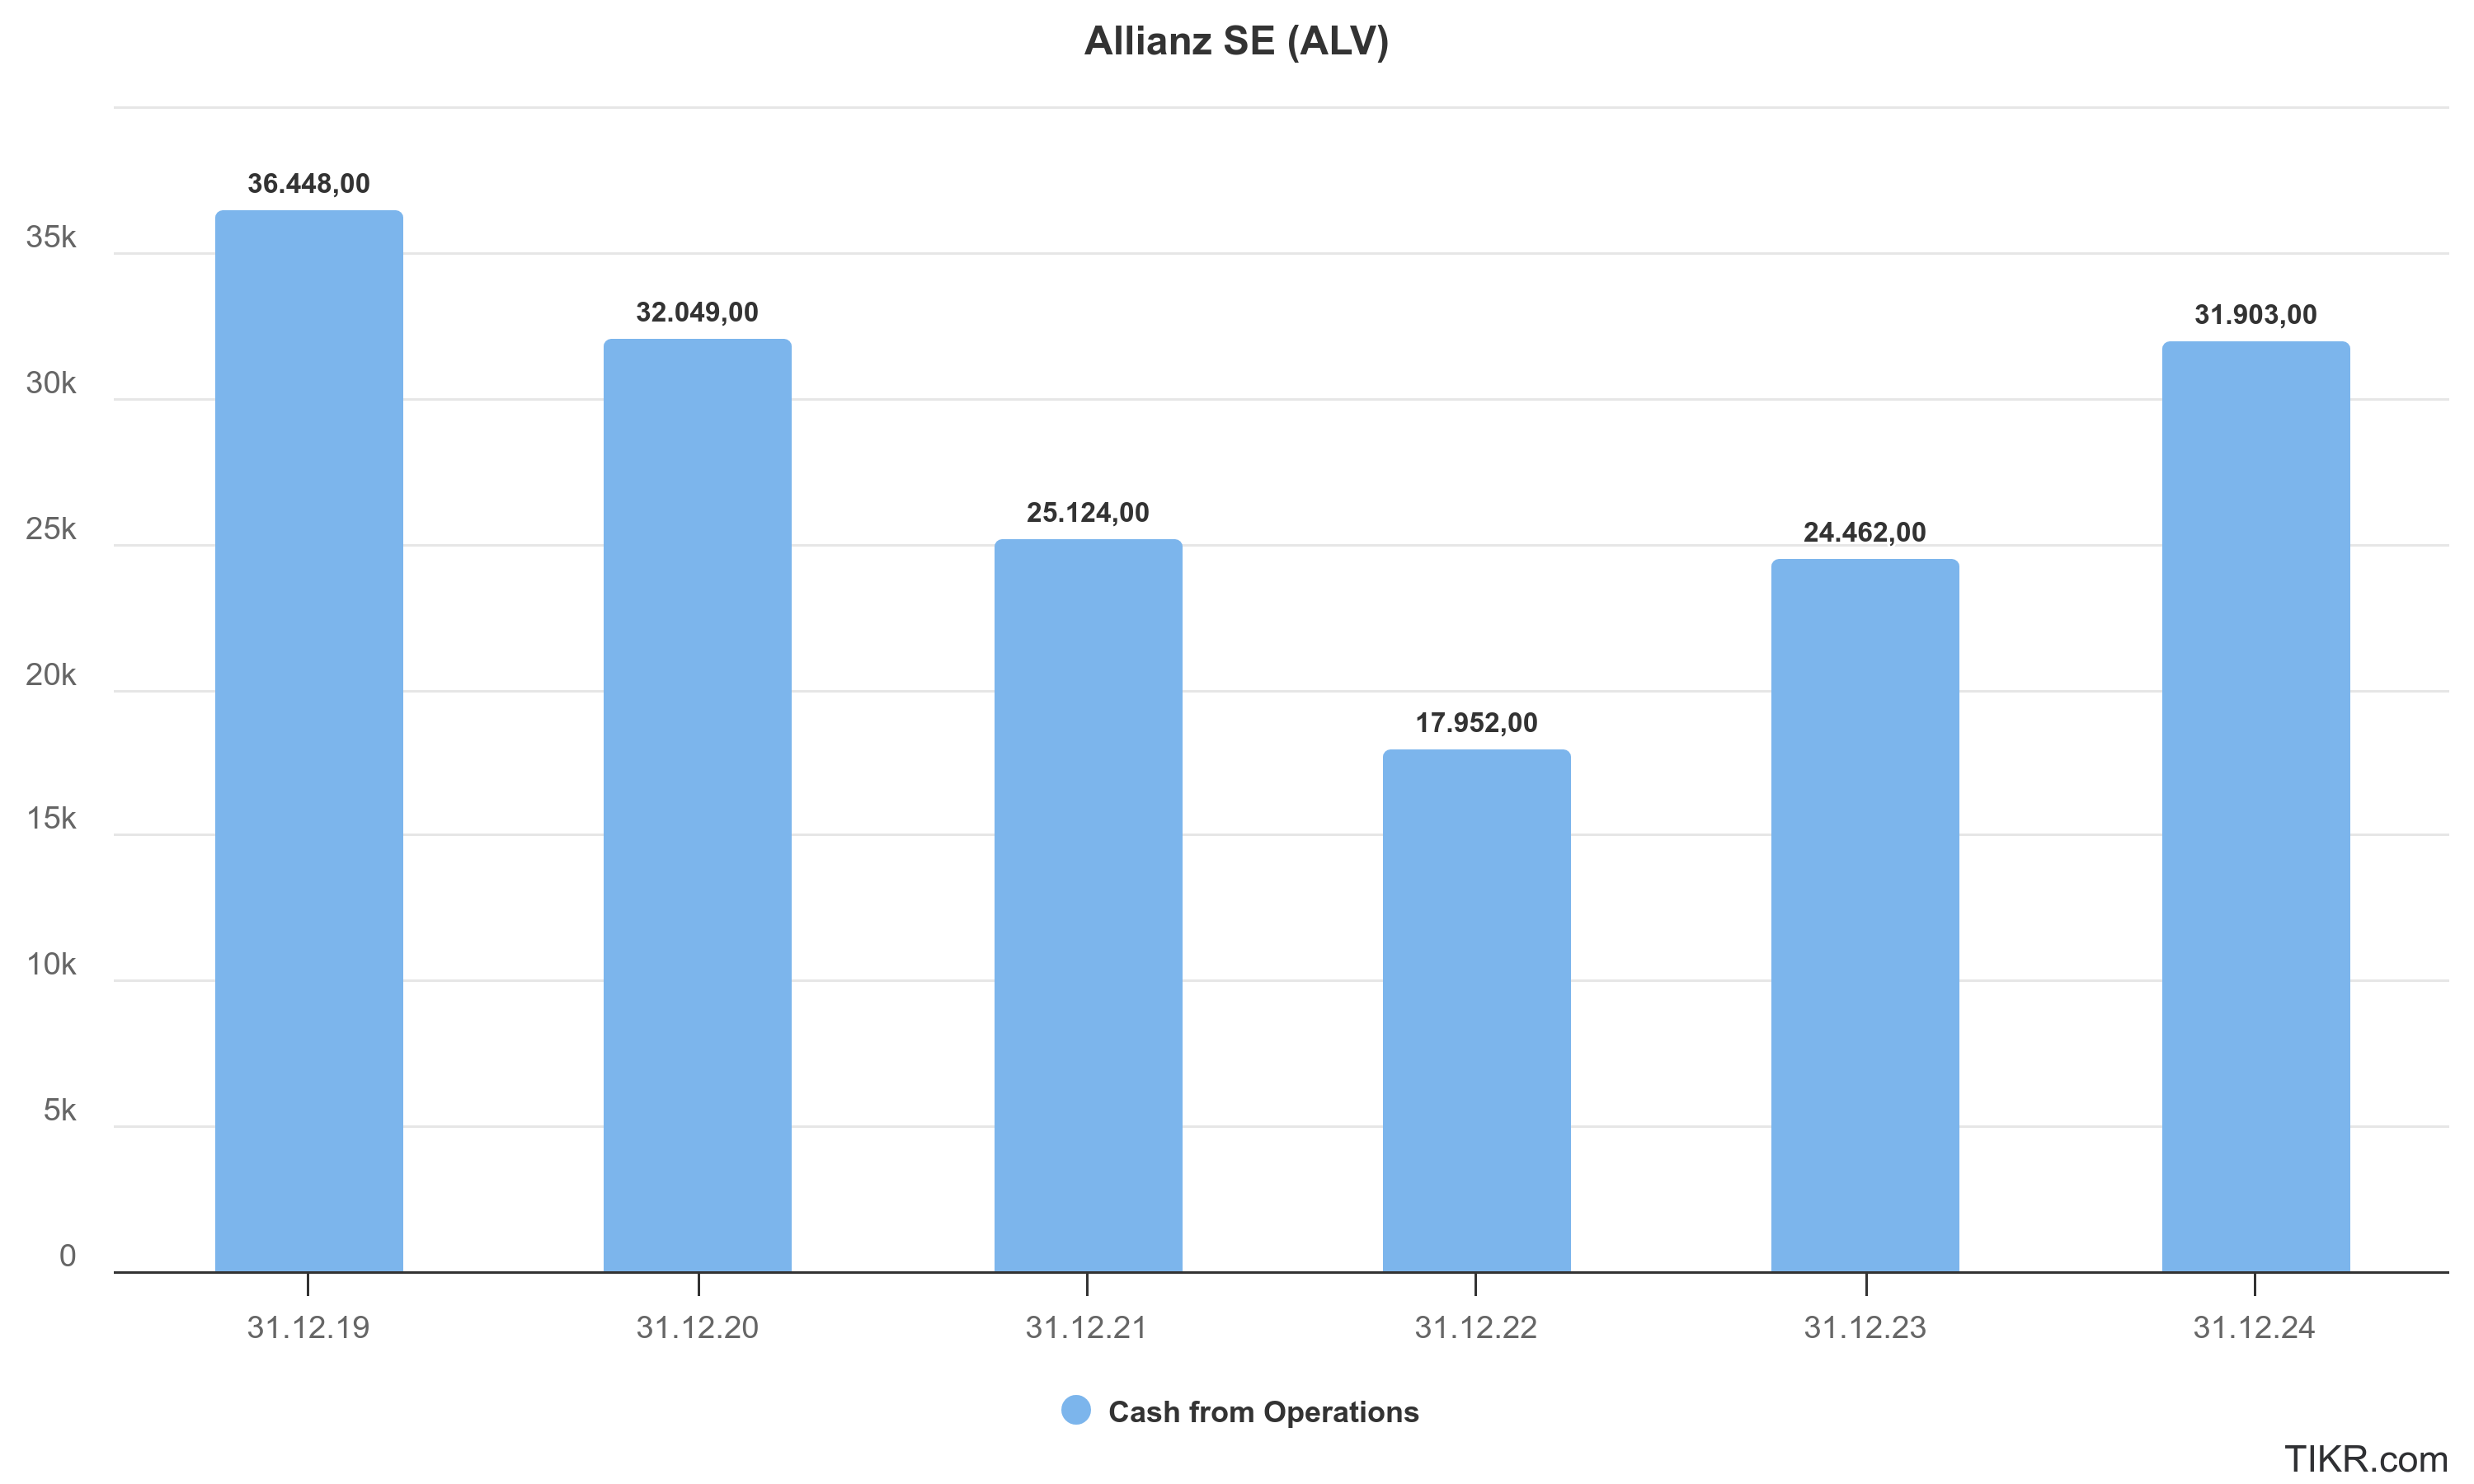
15. How much cash is the company generating?
Allianz’s business model generates substantial cash flows, primarily from premium inflows and investment income. The company has a strong operating cash flow, as premiums are collected upfront and claims are paid over time (especially in life insurance, where premiums today fund benefits much later). In 2024, Allianz’s operating cash flow (as per the cash flow statement) was boosted by the growth in business and investment returns.
16. What is the free cash flow margin?

17. How does the cash conversion cycle look like?
Cash Conversion Cycle: The cash conversion cycle in a manufacturing sense (days receivable + inventory minus payable) isn’t directly applicable to insurance, but we can discuss how cash flows through Allianz’s insurance operations. Insurers typically enjoy a “negative” cash conversion cycle – they get cash upfront (premiums) and pay out later (claims), which is effectively favorable for cash flow. Allianz collects premiums from policyholders daily; these premiums are invested until claims or benefits are paid. For P/C policies, the time between premium receipt and claim payment can range from months to even years (for long-tail liability lines), meaning Allianz holds and earns investment income on that cash in the interim. In life insurance, there is often an even longer duration between premium collection and benefit payout (e.g., life policies might pay out decades later), although life products also have an investment component for policyholders.
Thus, Allianz’s operating cycle is such that it is generally cash-flow positive on operations at any given time – incoming premiums and investment income usually exceed outgoing claims and expenses, except in extraordinary loss events. Even when large claims hit (e.g. natural disasters), Allianz can tap its accumulated cash and investments (or reinsurance recoveries) to pay – it doesn’t rely on short-term working capital financing like a manufacturing firm might. The concept of a cash conversion cycle (CCC) in days doesn’t translate perfectly, but one could say Allianz has a negative CCC because it receives funds before it needs to disburse them for claims.
To illustrate: unearned premiums on the balance sheet (premiums received for coverage not yet provided) were a significant liability, meaning cash in hand awaiting earning. Also, loss reserves (liabilities for future claims) are essentially money Allianz is holding to pay claims – until those claims are paid, that reserve is effectively a source of cash (invested assets) for Allianz. In 2024, Allianz’s insurance contract liabilities were €800.5 bn, funded by investments of similar magnitude; this highlights how premiums taken in are invested as long-term funds.
Overall, Allianz’s cash flow profile is very healthy. The cash conversion from premiums to available cash is efficient, allowing the company to pay a growing dividend and execute share buybacks while still investing in growth. The cash conversion cycle in the classical sense is not an issue – if anything, Allianz benefits from effectively using the float (customer premiums) as a source of investment income, which is a core advantage of the insurance business model.
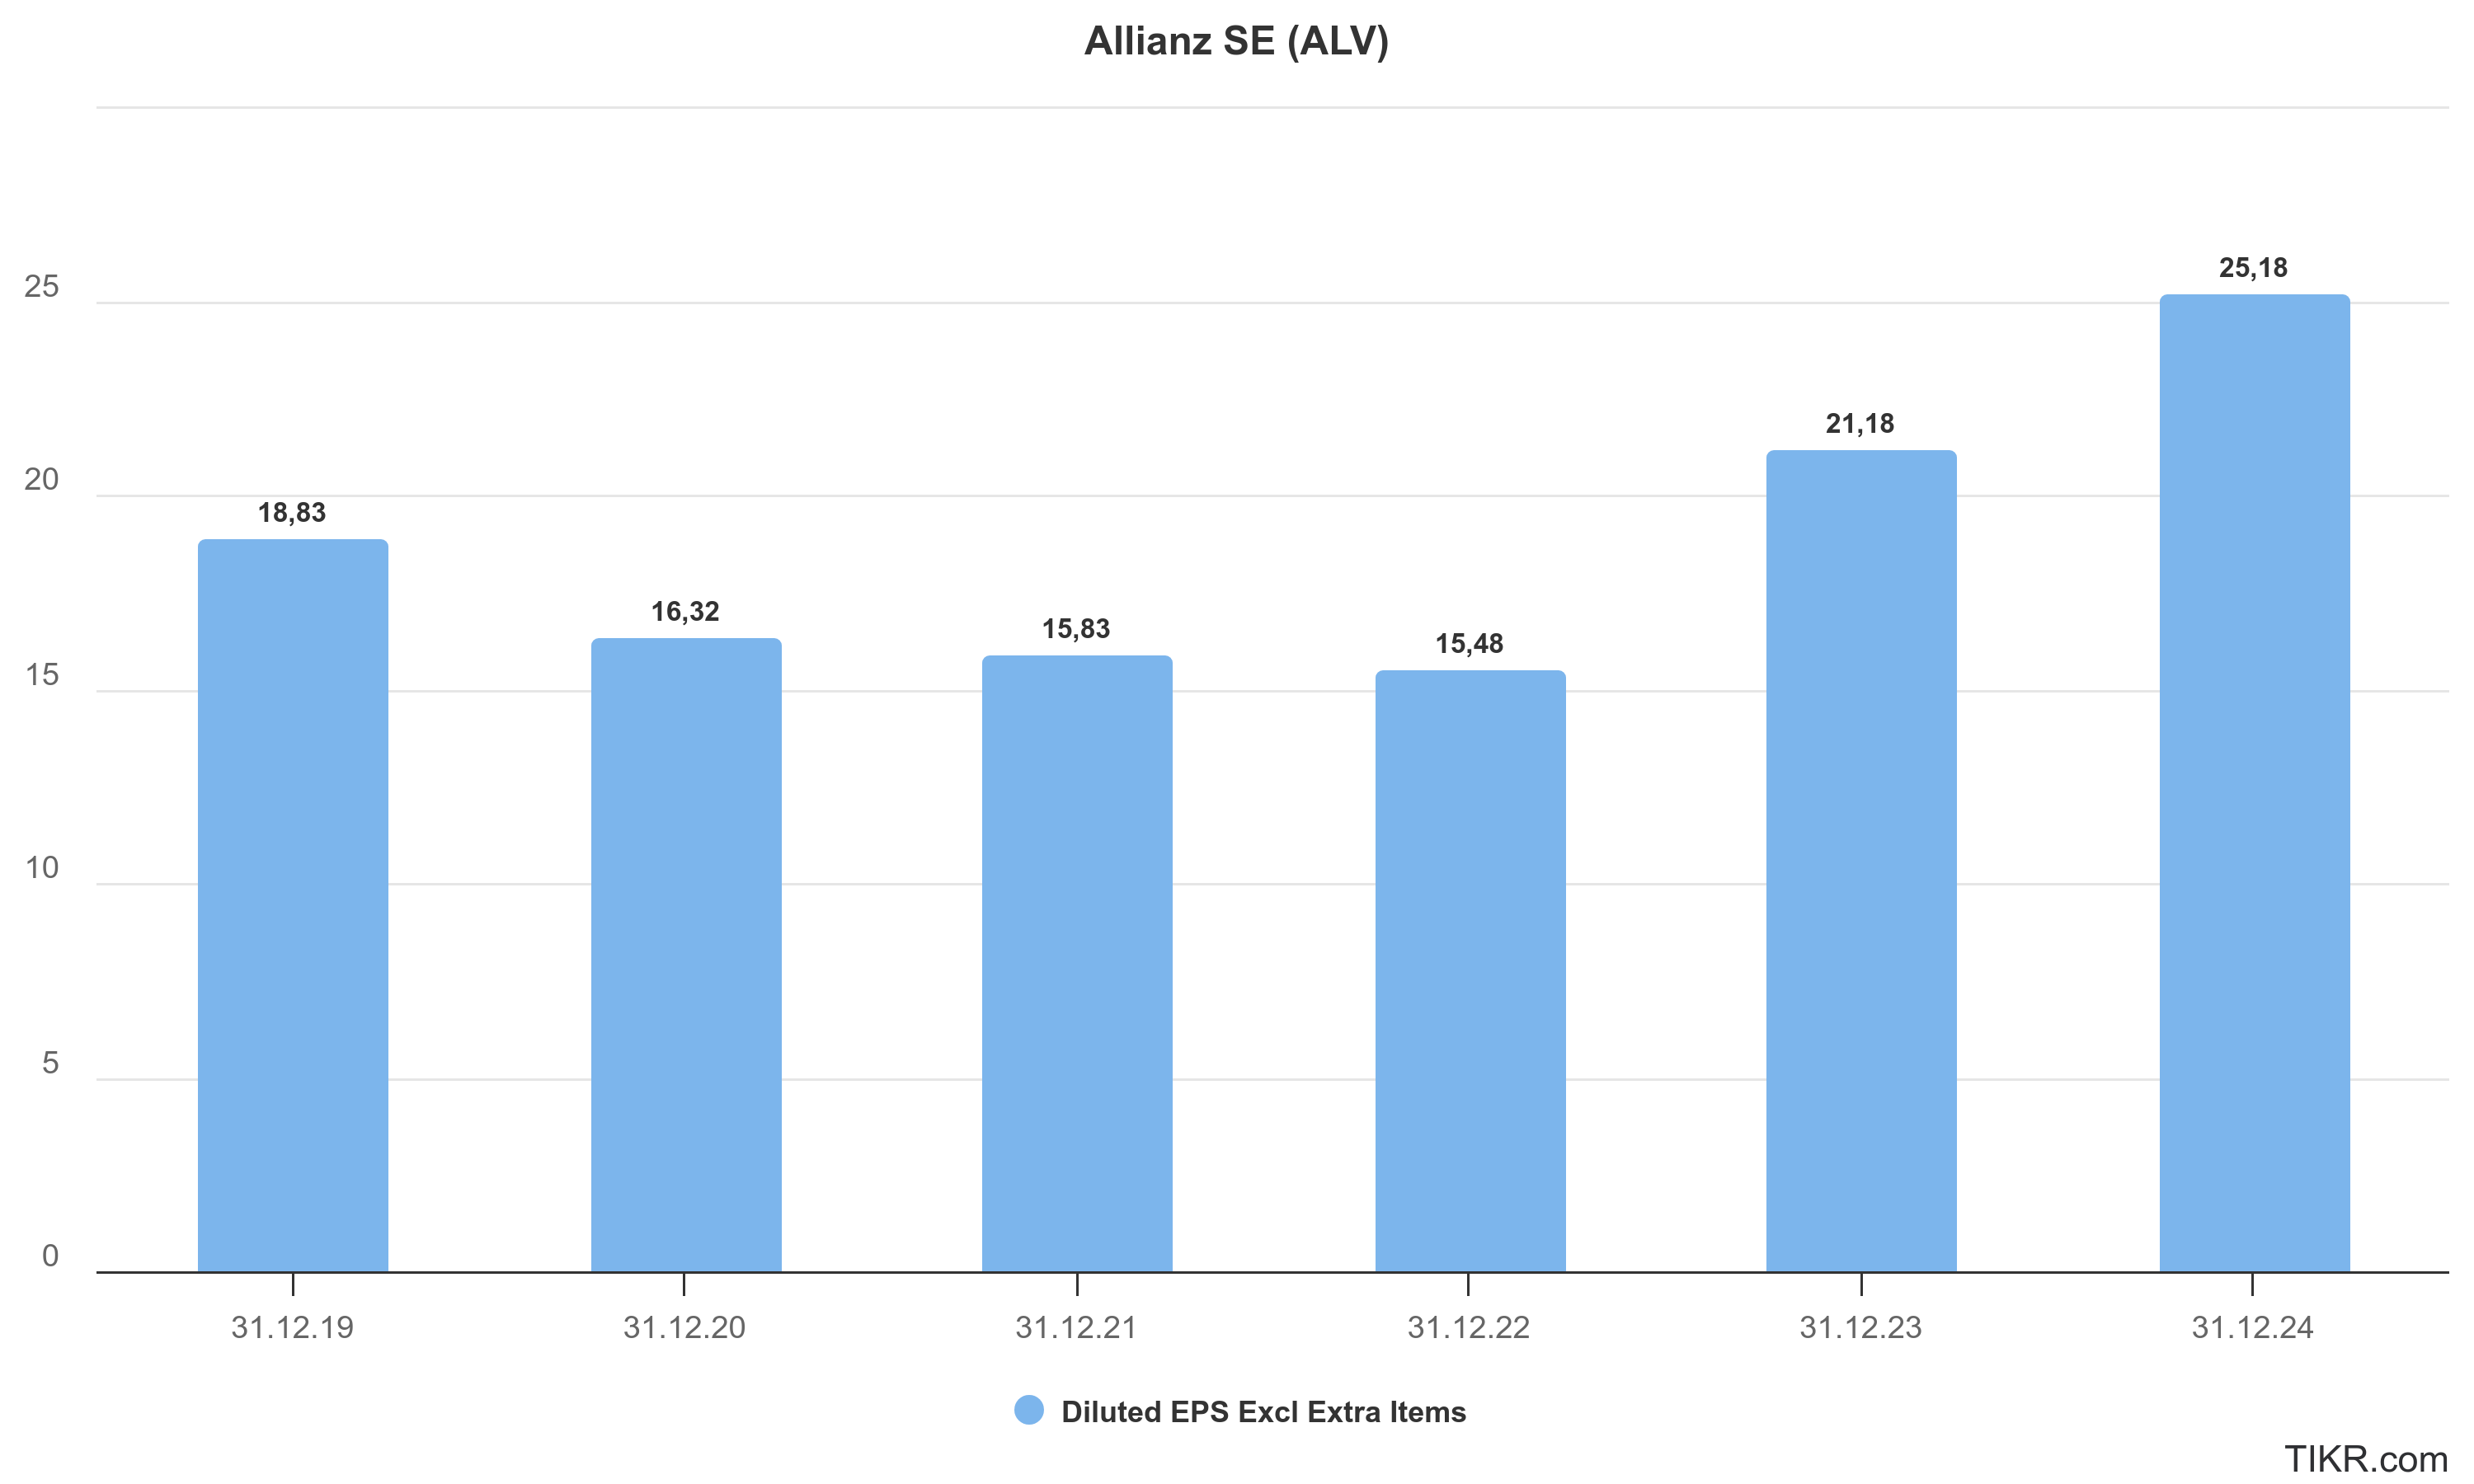
18. How did EPS developed?
Allianz’s earnings per share (EPS) has shown an upward trend over the 2019–2024 period, with some dips in the middle due to extraordinary events.
Key drivers of EPS changes:
Net income changes: EPS largely follows the net income trend. The drop in EPS in 2020–2021 corresponded to lower profits (pandemic losses and legal provisions). The sharp rise in 2022–2024 corresponds to recovered and then record profits.
Share buybacks: Allianz has been actively repurchasing shares, which reduces the number of shares outstanding and thus boosts EPS (since earnings are divided among fewer shares). For example, Allianz bought back €1 billion of shares in late 2022 and another €1.5 billion in 2024, and announced a new €2 bn buyback for 2025. The share count has decreased from around 430 million in 2018 to about 395 million by end of 2024. This buyback activity added a few percentage points to EPS growth each year. In 2024 alone, the share count drop contributed roughly 3-4% of the 18.9% EPS increase (the rest coming from higher earnings).
One-offs: EPS in 2021 was depressed by one-off losses (Structured Alpha fund settlement). Excluding that, the underlying EPS trajectory would show a smoother growth. By 2023–2024, EPS reflects mainly core operations without such charges, hence showing strong growth.
19. What is the equity ratio?
Allianz’s balance sheet is heavy with insurance liabilities, which means the proportion of assets funded by equity is relatively low (common for insurers). The equity ratio – calculated as total equity divided by total assets – was about 6.13% at end of 2024. Specifically, total equity was €64.1 billion (including €60.3 bn shareholders’ equity) against total assets of €1,044.6 billion. This level is normal for a large insurer, as most of the balance sheet is composed of policy reserves (liabilities) offset by invested assets. Allianz maintains strong capital adequacy as measured by regulatory metrics (Solvency II ratio 209%), even though the simple equity-to-assets looks low. The stability of the equity ratio over time suggests that Allianz has not dramatically altered its leverage – it is well-capitalized, with equity growing in tandem with the business (aside from marking to market fluctuations).
It’s worth noting that part of Allianz’s capital includes undated subordinated bonds counted as equity (around €4.9 bn in 2024). These enhance capitalization but are not common equity. The equity figures above include those. If one looked at tangible common equity only, the ratio would be slightly lower, but still in the same ballpark.

20. How much debt does it have?
Allianz carries a moderate amount of financial debt on its balance sheet, primarily in the form of senior and subordinated bonds issued by the holding company. As of December 31, 2024, Allianz’s total financial liabilities were €66.14 billion. This broad figure includes not just debt, but also other financial obligations (like deposits, repurchase agreements, etc.). Focusing on borrowings: Allianz SE (the holding) had outstanding bonds totaling about €21.3 billion at end-2024 (this comprises ~€17.2 bn senior bonds and €4.1 bn subordinated bonds classified as debt). Additionally, Allianz has undated subordinated bonds of €4.9 billion that are counted in equity (these are perpetual hybrids). So altogether, total issued debt and hybrid capital is around €26.2 bn (debt €21.3 + €4.9 bn hybrid).

The €66.1 bn “financial liabilities” includes other items such as bank deposits from Allianz’s banking operations, collateral payable on derivatives, and lease liabilities. For instance, Allianz’s treasury may issue commercial paper or have repurchase agreement liabilities which show up in that number. Indeed, the increase from €58.3 bn in 2023 to €66.1 bn in 2024 in financial liabilities was partly due to reclassifying some non-controlling interests to liabilities and potentially higher short-term borrowings. But for leverage analysis, the focus is on interest-bearing debt of ~€21 bn (which is quite manageable relative to the size of Allianz).
21. What is the Net debt/EBITDA ratio?
Insurance companies don’t use EBITDA as a primary metric, but we can approximate net debt/EBITDA to gauge leverage. Let’s define EBITDA loosely as operating profit plus depreciation/amortization (in Allianz’s case, operating profit ~€16.0 bn in 2024 and depreciation is relatively small ~€0.3 bn, so ~€16.3 bn EBITDA). Net debt can be taken as total debt minus cash. Allianz had cash and cash equivalents of €31.6 bn at end-2024. Subtracting the ~€21.3 bn of debt, Allianz effectively has no net debt on a consolidated basis – in fact, cash exceeds debt by about €10 bn. However, much of that cash is held in insurance entities for liquidity needs, so another approach is to consider the holding company net debt. The holding company’s cash might be lower (Allianz SE had, say, a few billion cash), but even so, net debt/EBITDA is very comfortable. Using group figures: net debt (debt €21.3 – cash €31.6) is negative, implying net cash. If we include only financial liabilities considered debt (and not all cash equivalents), one might calculate a net debt/EBITDA ~2.2x using net debt ~€34.5 bn (financial liabilities €66.1 bn – cash €31.6 bn) and EBITDA ~€16 bn. But this overstates debt by including deposits etc. A more appropriate calculation might use the €26.2 bn total bonds (including hybrids) as “debt” and perhaps count only unrestricted cash at holding – which would still yield a ratio well below 2x.
In summary, Allianz’s leverage is low: Net debt/EBITDA ~2x or less, depending on definition. This is far lower than industrial companies, and reflects the fact that Allianz’s debt is dwarfed by its earnings and cash flow. The company’s strong interest coverage (see below) further attests to low leverage risk. Rating agencies view Allianz’s financial leverage (debt-to-total capital) as moderate; the slight uptick in 2024 is not concerning given excess cash and capital.
22. What the interest coverage ratio?
Interest Coverage: Allianz’s ability to cover interest expense from earnings is excellent. In 2024, Allianz’s interest expenses on external debt were €762 million (not including interest credited to policyholders, which is part of insurance benefits). The coverage can be calculated as Operating profit (€16.0 bn) / €0.762 bn ≈ 21×. Even using income before tax (€14.0 bn) / interest €0.762 bn, it’s ~18×. This means Allianz’s earnings could drop dramatically and it would still comfortably cover its interest obligations. In 2023, interest expense was €631 million and OP was €14.7 bn, so coverage was even higher (~23×).
23. How did debt levels developed?
Debt Trends: Over 2019–2024, Allianz’s absolute debt increased slightly, but relative leverage remained stable. For example, senior and sub debt was ~€20 bn in 2019, went to ~€24.7 bn by 2023 (including hybrids), and ~€26.2 bn in 2024. This gradual increase corresponds to occasional new debt issuances – often for refinancing or capital optimization. The net debt to equity ratio went from about 25% in 2019 to ~35% in 2024 (as equity fluctuated and debt rose modestly). Importantly, Allianz’s debt management is conservative: they maintain long maturities and mainly fixed-rate funding. The maturity profile as of 2024 shows no significant near-term refinancing risk, with most debt due beyond 5 years.
The company’s financial policy aims to keep a strong credit rating (which it has: AA rating from S&P with stable outlook), so they won’t let debt balloon. The Solvency II ratio of 209% also implies ample capital above regulatory needs, meaning Allianz isn’t leveraging up to a risky extent.
A solvency ratio is a key financial metric that assesses an insurance company's ability to meet its long-term obligations. It is calculated by dividing the company's eligible own funds by its Solvency Capital Requirement (SCR). A ratio above 100% indicates that the company possesses sufficient capital to cover its risks, with higher percentages reflecting greater financial stability. For insurance companies, maintaining a robust solvency ratio is crucial. It ensures they have adequate financial resources to honor policyholder claims, even in adverse situations. This not only protects policyholders but also fosters confidence among investors and regulators regarding the company's financial health.
This is Part II of the Allianz SE analysis. Part III, covering the capital allocation, investment thesis and valuation will be published soon—stay tuned!
Thank you once again for being here and for your interest! If you enjoyed my analysis, please consider leaving a "like" and subscribing. Your support means a lot!
Disclaimer: The information provided in this publication is for educational and informational purposes only and does not constitute financial advice. The content is solely reflective of my personal views and opinions based on my research and is not intended to be used as a basis for investment decisions. While every effort is made to ensure that the information is accurate and up-to-date, the writer makes no representations as to the accuracy, completeness, suitability, or validity of any information in this post and will not be liable for any errors, omissions, or delays in this information or any losses, injuries, or damages arising from its display or use. All readers are advised to conduct their own independent research or consult a professional financial advisor before making any investment decisions. The author is invested in the mentioned stock.
Great writeup